
Horizontal Box and Whisker Graph Comparison
Loading the math board and drawing, please wait…
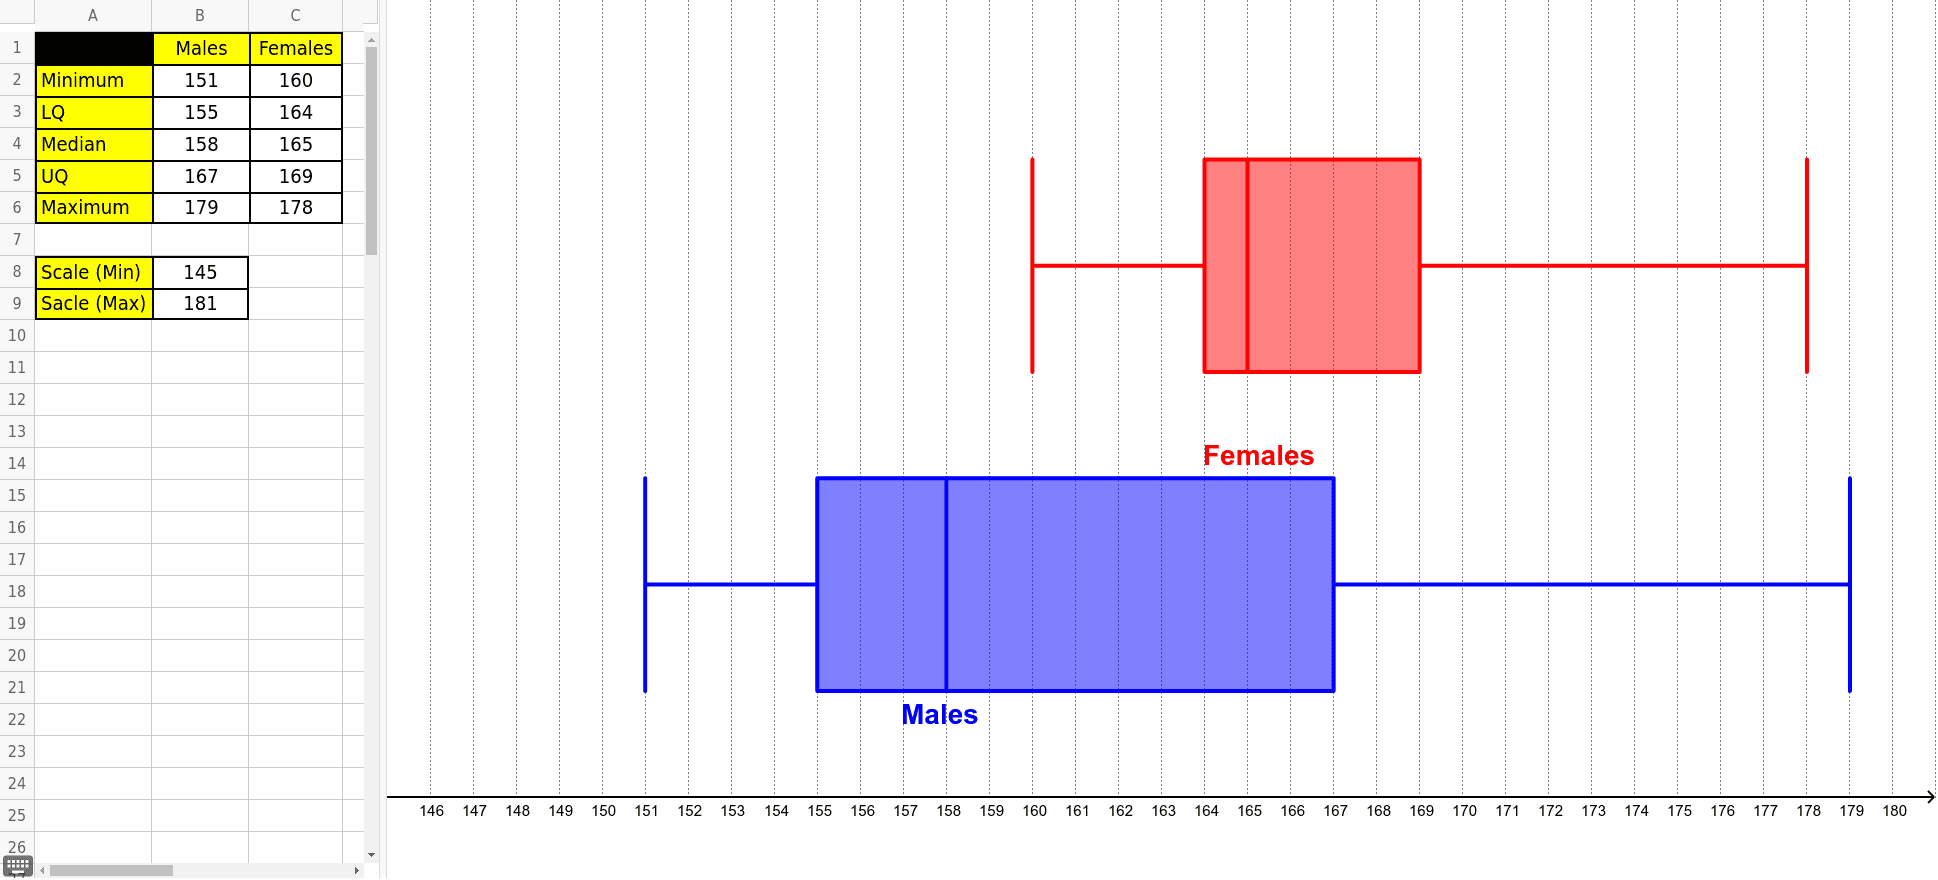
① This example demonstrates how to create horizontal box-and-whisker plots in GeoGebra to compare the distribution characteristics of multiple datasets. ② Core mathematical concepts include the five-number summary (minimum, lower quartile, median, upper quartile, maximum), interquartile range (IQR), outlier detection, and visual comparison of data spread and skewness. ③ Construction highlights: The BoxPlot command is used, along with multiple data point objects (A2–A6, B1–B6, C1–C6) and auxiliary objects (b, a, text1, text2) to render horizontal box plots side by side, enabling clear visual comparison of central tendency and variability. ④ Suitable for middle school statistics units, high school data analysis, or introductory college statistics courses; it serves as an interactive teaching tool for comparing datasets, discussing variance, and exploring distribution shapes.
GeoGebra Commands & Parameters
BoxPlot(10, 2, C2, C3, C4, C5, C6) → bBoxPlot(4, 2, B2, B3, B4, B5, B6) → a
AI Drawing Prompt Reference
Create two horizontal box plots for comparing data sets. First, plot the box plot for data points C2 to C6, then plot the box plot for data points B2 to B6. Arrange the two box plots horizontally to clearly compare the central tendency and variability of the data sets.
The prompt above was compiled from the original drawing commands and is for reference only.