
Hole 17
Loading the math board and drawing, please wait…
In collections
GeoGolf
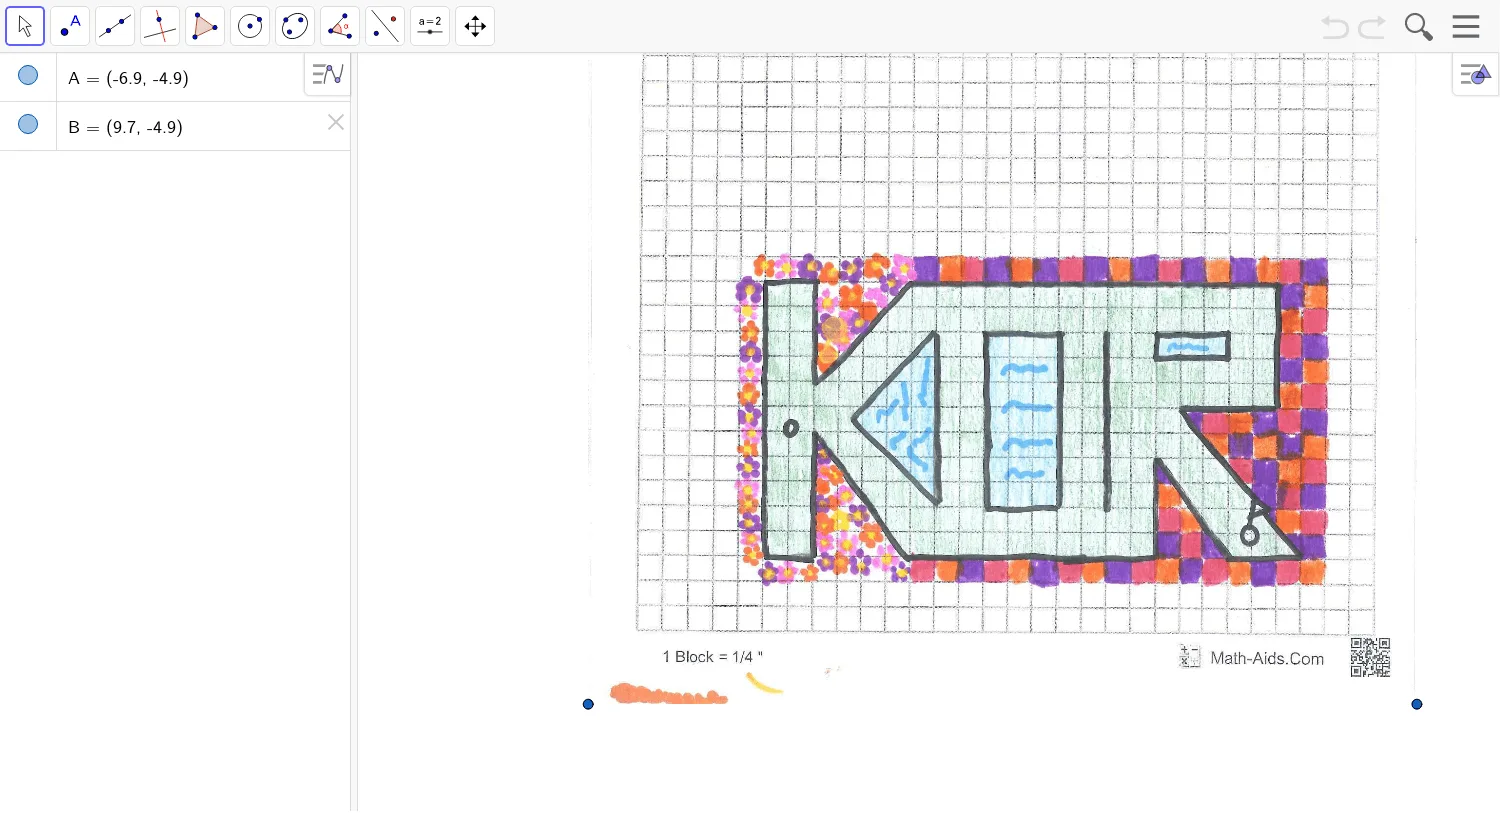
This example demonstrates the hypergeometric distribution in probability and statistics. By adjusting parameters, you can observe the probability distribution under different conditions. The objects A and B in GeoGebra are used to define the distribution parameters, while pic1 displays the distribution graph. Suitable for high school probability and statistics courses.
GeoGebra Commands & Parameters
Point A(-6.896, -4.894000000000002)Point B(9.6784, -4.894000000000002)
AI Drawing Prompt Reference
Draw a probability distribution graph showing the hypergeometric distribution. Adjust parameters to observe the distribution under different conditions. Place two points at coordinates (-6.896, -4.894) and (9.6784, -4.894) to represent distribution parameters A and B, then draw the hypergeometric distribution graph based on these points.
The prompt above was compiled from the original drawing commands and is for reference only.