
Histograms, Mean and Standard Deviation
Loading the math board and drawing, please wait…
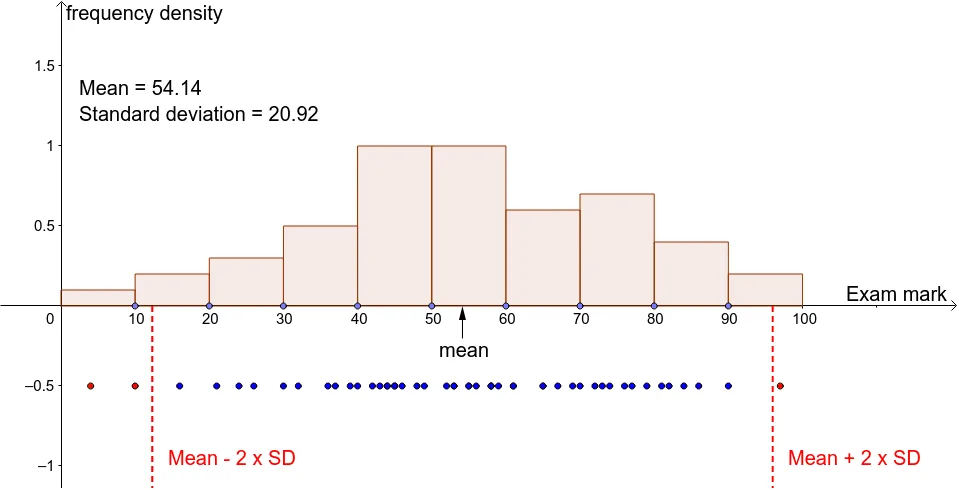
This example demonstrates how to use GeoGebra to create histograms and calculate display the mean and standard deviation of data. Core math concepts include histograms, probability & statistics, mean, and standard deviation. Key GeoGebra commands/objects used in construction are Function, Point, SD, Mean, Segment, If, Div, Histogram, Vector, and Polygon. Suitable for high school mathematics teaching, helping students understand data distribution characteristics and statistical calculations.
GeoGebra Commands & Parameters
Function(-0.5, 0, 100) → fPoint(f) → A50Point(f) → A49Point(f) → A48Point(f) → A47Point(f) → A46Point(f) → A45Point(f) → A44Point(f) → A43Point(f) → A42Point(f) → A41Point(f) → A40Point(f) → A39Point(f) → A38Point(f) → A37Point(f) → A36Point(f) → A35Point(f) → A34Point(f) → A33Point(f) → A32Point(f) → A31Point(f) → A30Point(f) → A29Point(f) → A28Point(f) → A27Point(f) → A26Point(f) → A25Point(f) → A24Point(f) → A23Point(f) → A22Point(f) → A21Point(f) → A20Point(f) → A19Point(f) → A18Point(f) → A17Point(f) → A16Point(f) → A15Point(f) → A14Point(f) → A13Point(f) → A12Point(f) → A11Point(f) → A10Point(f) → A9Point(f) → A8Point(f) → A7Point(f) → A6Point(f) → A5Point(f) → A4Point(f) → A3Point(f) → A2Point(f) → A1SD(L_1) → sdMean(L_1) → meanSegment((r, -2), (r, 0)) → cIf((B1 < r) ∨ (B1 > p), 1, 0) → C1If((B2 < r) ∨ (B2 > p), 1, 0) → C2If((B3 < r) ∨ (B3 > p), 1, 0) → C3If((B4 < r) ∨ (B4 > p), 1, 0) → C4If((B5 < r) ∨ (B5 > p), 1, 0) → C5If((B6 < r) ∨ (B6 > p), 1, 0) → C6If((B7 < r) ∨ (B7 > p), 1, 0) → C7If((B8 < r) ∨ (B8 > p), 1, 0) → C8If((B9 < r) ∨ (B9 > p), 1, 0) → C9If((B10 < r) ∨ (B10 > p), 1, 0) → C10If((B11 < r) ∨ (B11 > p), 1, 0) → C11If((B12 < r) ∨ (B12 > p), 1, 0) → C12If((B13 < r) ∨ (B13 > p), 1, 0) → C13If((B14 < r) ∨ (B14 > p), 1, 0) → C14If((B15 < r) ∨ (B15 > p), 1, 0) → C15If((B16 < r) ∨ (B16 > p), 1, 0) → C16If((B17 < r) ∨ (B17 > p), 1, 0) → C17If((B18 < r) ∨ (B18 > p), 1, 0) → C18If((B19 < r) ∨ (B19 > p), 1, 0) → C19If((B20 < r) ∨ (B20 > p), 1, 0) → C20If((B21 < r) ∨ (B21 > p), 1, 0) → C21If((B22 < r) ∨ (B22 > p), 1, 0) → C22If((B23 < r) ∨ (B23 > p), 1, 0) → C23If((B24 < r) ∨ (B24 > p), 1, 0) → C24If((B25 < r) ∨ (B25 > p), 1, 0) → C25If((B26 < r) ∨ (B26 > p), 1, 0) → C26If((B27 < r) ∨ (B27 > p), 1, 0) → C27If((B28 < r) ∨ (B28 > p), 1, 0) → C28If((B29 < r) ∨ (B29 > p), 1, 0) → C29If((B30 < r) ∨ (B30 > p), 1, 0) → C30If((B31 < r) ∨ (B31 > p), 1, 0) → C31If((B32 < r) ∨ (B32 > p), 1, 0) → C32If((B33 < r) ∨ (B33 > p), 1, 0) → C33If((B34 < r) ∨ (B34 > p), 1, 0) → C34If((B35 < r) ∨ (B35 > p), 1, 0) → C35If((B36 < r) ∨ (B36 > p), 1, 0) → C36If((B37 < r) ∨ (B37 > p), 1, 0) → C37If((B38 < r) ∨ (B38 > p), 1, 0) → C38If((B39 < r) ∨ (B39 > p), 1, 0) → C39If((B40 < r) ∨ (B40 > p), 1, 0) → C40If((B41 < r) ∨ (B41 > p), 1, 0) → C41If((B42 < r) ∨ (B42 > p), 1, 0) → C42If((B43 < r) ∨ (B43 > p), 1, 0) → C43If((B44 < r) ∨ (B44 > p), 1, 0) → C44If((B45 < r) ∨ (B45 > p), 1, 0) → C45If((B46 < r) ∨ (B46 > p), 1, 0) → C46If((B47 < r) ∨ (B47 > p), 1, 0) → C47If((B48 < r) ∨ (B48 > p), 1, 0) → C48If((B49 < r) ∨ (B49 > p), 1, 0) → C49If((B50 < r) ∨ (B50 > p), 1, 0) → C50Segment((p, -2), (p, 0)) → bDiv(Min[L_1], 1) → dPoint(xAxis) → APoint(xAxis) → BPoint(xAxis) → CPoint(xAxis) → DPoint(xAxis) → EPoint(xAxis) → FPoint(xAxis) → GPoint(xAxis) → HPoint(xAxis) → IHistogram({0, x(A), x(B), x(C), x(D), x(E), x(F), x(G), x(H), x(I), 100}, L_1) → aVector((mean, -0.2), (mean, 0)) → uPolygon(J, K, L, M) → poly1, j, k, l, m
AI Drawing Prompt Reference
Draw a function graph from 0 to 100, then place 50 points on the graph to create a histogram showing the data distribution. Calculate and display the mean and standard deviation of the data.
The prompt above was compiled from the original drawing commands and is for reference only.