
Histogram Statistics
Loading the math board and drawing, please wait…
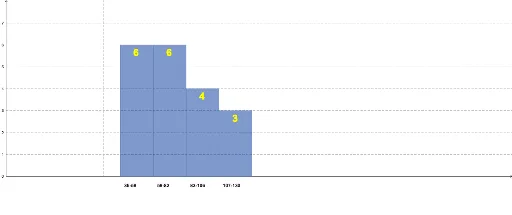
This example demonstrates how to use GeoGebra to create histograms and display statistical data. Core math concepts include data distribution, percentage calculations, sine function graphs, and equilateral triangles. Construction highlights involve commands like Sequence, Min, Max, CountIf, and Textfield, along with objects such as lists and sliders. Suitable for high school mathematics teaching, combining probability statistics with function graphing.
GeoGebra Commands & Parameters
Sequence(((a * i) - (a * 0.5), 0), i, 1, B2) → liste2Sequence(((a * i) + (a * 0.5), 0), i, 1, B2) → liste3Sequence((x(Element[liste2, i]) + x(Element[liste3, i])) / 2, i, 1, B2) → liste12Min(liste1) → B6Max(liste1) → B5CountIf(M15 ≤ x ≤ M16, liste1) → M18CountIf(L15 ≤ x ≤ L16, liste1) → L18CountIf(K15 ≤ x ≤ K16, liste1) → K18CountIf(J15 ≤ x ≤ J16, liste1) → J18CountIf(I15 ≤ x ≤ I16, liste1) → I18CountIf(H15 ≤ x ≤ H16, liste1) → H18CountIf(G15 ≤ x ≤ G16, liste1) → G18CountIf(F15 ≤ x ≤ F16, liste1) → F18CountIf(E15 ≤ x ≤ E16, liste1) → E18CountIf(D15 ≤ x ≤ D16, liste1) → D18CountIf(C15 ≤ x ≤ C16, liste1) → C18CountIf(B15 ≤ x ≤ B16, liste1) → B18Sequence(((a * i) + (a * 0.5), Element[liste4, i]), i, 1, B2) → liste6Sequence(((a * i) - (a * 0.5), Element[liste4, i]), i, 1, B2) → liste5Sequence((x(Element[liste5, i]) + x(Element[liste6, i])) / 2, i, 1, B2) → liste11Sequence(y(Element[liste6, i]) - 0.5, i, 1, B2) → liste10Sequence(Polygon[Element[liste2, i], Element[liste3, i], Element[liste6, i], Element[liste5, i]], i, 1, B2) → liste7Textfield(B2) → MetinAlanı1Sequence((Element[liste12, i] - (a * 0.38), -0.5), i, 1, B2) → liste8Sequence((Element[liste11, i] - (a * 0.1), Element[liste10, i]), i, 1, B2) → liste9Textfield(B2) → MetinAlanı1_1Textfield(liste1) → Data