
Probability Scale
Loading the math board and drawing, please wait…
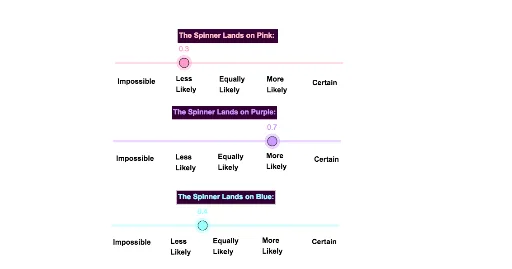
This example demonstrates the concept of a probability scale, involving core probability concepts. Using GeoGebra commands such as Pink, Purple, Blue objects, and text1 to text18, a visual probability scale model is constructed. Suitable for middle school and above students to learn probability & statistics.
GeoGebra Commands & Parameters
Numeric Pink(0.3)Numeric Purple(0.7)Numeric Blue(0.4)
AI Drawing Prompt Reference
Create a probability scale diagram with three regions in pink, purple, and blue, representing probabilities of 0.3, 0.7, and 0.4 respectively. Start by drawing the pink region for probability 0.3, then the purple region for probability 0.7, and finally the blue region for probability 0.4. Ensure the regions are ordered by their probabilities, with the pink region on the left, followed by purple, and blue on the right.
The prompt above was compiled from the original drawing commands and is for reference only.