
Histogram Construction Example by meltonj
Loading the math board and drawing, please wait…
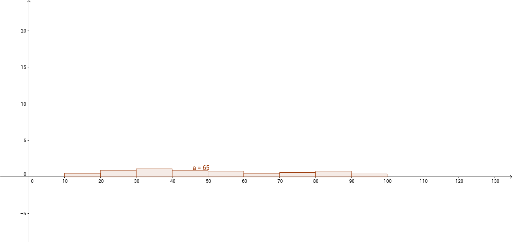
This example demonstrates how to construct a histogram using GeoGebra, visually representing data distribution. Core math concepts include data statistics, frequency distribution, and histogram construction methods. The construction highlights the use of the GeoGebra Histogram command. Suitable for high school mathematics teaching, particularly introductory probability and statistics or data analysis.
GeoGebra Commands & Parameters
Histogram({10, 20, 30, 40, 50, 60, 70, 80, 90, 100}, {42, 54, 65, 76, 87, 98, 97, 86, 53, 42, 31, 32, 54, 13, 14, 15, 25, 26, 28, 39, 37, 38, 39, 75, 84, 73, 43, 68, 79, 39, 40, 80, 29, 40, 50, 35, 28, 35, 47, 57, 86, 90, 10, 11, 60, 70, 80, 56, 36, 27, 27, 48, 35, 48, 75, 63, 51, 87, 93, 27, 48, 59, 21, 65, 89}) → a
AI Drawing Prompt Reference
Create a histogram to represent the distribution of a set of data. The data includes multiple values ranging from 10 to 100, with frequencies of 42, 54, 65, 76, 87, 98, 97, 86, 53, 42, 31, 32, 54, 13, 14, 15, 25, 26, 28, 39, 37, 38, 39, 75, 84, 73, 43, 68, 79, 39, 40, 80, 29, 40, 50, 35, 28, 35, 47, 57, 86, 90, 10, 11, 60, 70, 80, 56, 36, 27, 27, 48, 35, 48, 75, 63, 51, 87, 93, 27, 48, 59, 21, 65, 89. The histogram should reflect the frequency distribution of these data.
The prompt above was compiled from the original drawing commands and is for reference only.