
Histogram by IT for Change
Loading the math board and drawing, please wait…
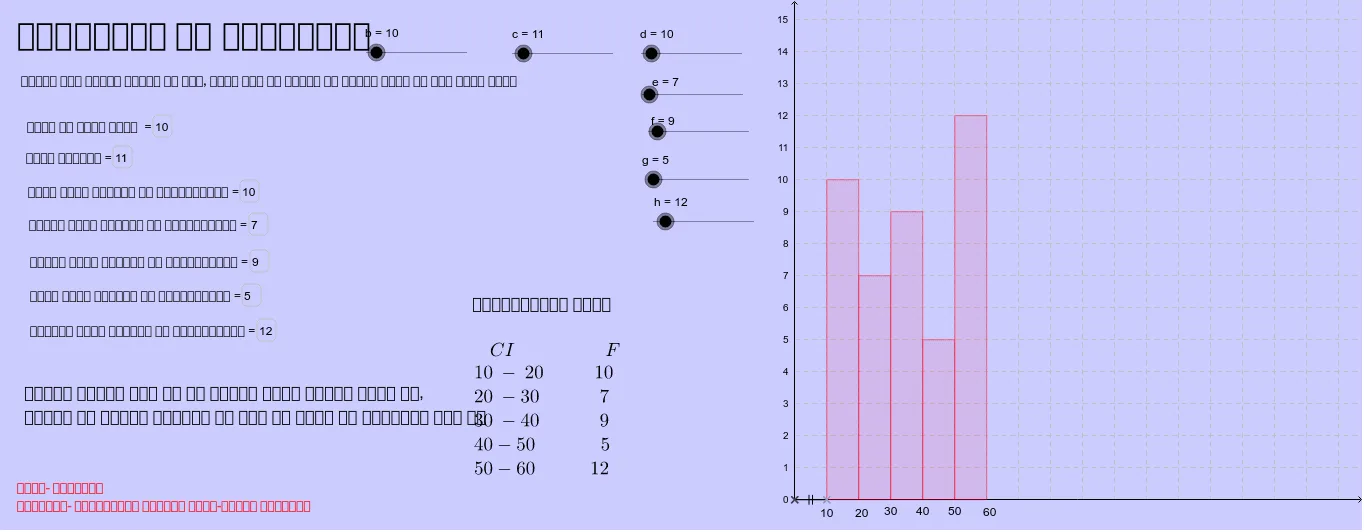
This example demonstrates how to create a histogram using GeoGebra's FrequencyPolygon and Histogram commands. A histogram is a type of statistical chart used to display data distribution. The example also involves constructing points, line segments, and text fields. Suitable for middle school and above students to learn statistics.
GeoGebra Commands & Parameters
FrequencyPolygon({-1, 0, 1, 2, 3, 4, 5, 6}, {d, e, f, g, h}) → iHistogram({1, 2, 3, 4, 5, 6}, {d, e, f, g, h}) → aIntersect(xAxis, yAxis) → APoint(xAxis) → BSegment(A, B) → jTextfield(b) → inputBox1Textfield(c) → inputBox2Textfield(d) → inputBox3Textfield(e) → inputBox4Textfield(f) → inputBox5Textfield(g) → inputBox6Textfield(h) → inputBox7
AI Drawing Prompt Reference
Create a histogram to show data distribution. First, input the data points 1, 2, 3, 4, 5, 6 and their frequencies d, e, f, g, h. Then, draw the intersection of the x-axis and y-axis, and connect it to a point on the y-axis. Input text fields b, c, d, e, f, g, h as the frequency values. Use these data points and frequency values to draw the histogram and frequency polygon.
The prompt above was compiled from the original drawing commands and is for reference only.