
Histogram and Polygon
Loading the math board and drawing, please wait…
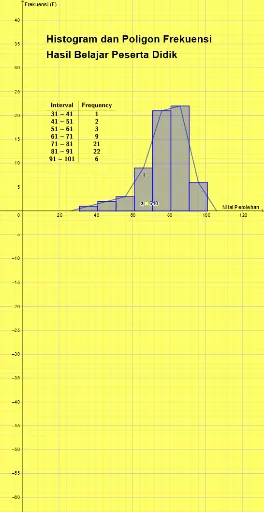
This example demonstrates the methods of drawing histograms and polygons. Key mathematical concepts include frequency distribution in statistics and polygon construction in geometry. Using GeoGebra commands such as Histogram, PolyLine, and FrequencyTable, the distribution of data and the drawing process of polygons are visually illustrated. Suitable for middle school students to learn data statistics and geometric construction.
GeoGebra Commands & Parameters
Histogram(false, Classes[{A1, A2, A3, A4, A5, A6, A7, A8, B1, B2, B3, B4, B5, B6, B7, B8, C1, C2, C3, C4, C5, C6, C7, C8, D1, D2, D3, D4, D5, D6, D7, D8, E1, E2, E3, E4, E5, E6, E7, E8, F1, F2, F3, F4, F5, F6, F7, F8, G1, G2, G3, G4, G5, G6, G7, G8, H1, H2, H3, H4, H5, H6, H7, H8}, 31, 10], {A1, A2, A3, A4, A5, A6, A7, A8, B1, B2, B3, B4, B5, B6, B7, B8, C1, C2, C3, C4, C5, C6, C7, C8, D1, D2, D3, D4, D5, D6, D7, D8, E1, E2, E3, E4, E5, E6, E7, E8, F1, F2, F3, F4, F5, F6, F7, F8, G1, G2, G3, G4, G5, G6, G7, G8, H1, H2, H3, H4, H5, H6, H7, H8}, true, -1) → aPolyLine((26, 0), (36, 1), (46, 2), (56, 3), (66, 9), (76, 21), (86, 22), (96, 6), (106, 0)) → fFrequencyTable(a) → text1
AI Drawing Prompt Reference
Draw a statistical histogram with horizontal axis representing data intervals and vertical axis representing frequencies. The histogram consists of adjacent rectangular bars, each bar's height corresponding to the frequency of data in that interval. Above the histogram, connect the midpoints of the tops of the bars with a polyline to form a frequency polygon. The polyline starts at the bottom left of the first bar, passes through the top midpoints of all bars, and ends at the bottom right of the last bar. Additionally, display a frequency distribution table nearby, listing each interval and its corresponding frequency. The overall layout should be clear for observing data distribution patterns.
The prompt above was compiled from the original drawing commands and is for reference only.