
Histogram and Geometric Transformations Demo
Loading the math board and drawing, please wait…
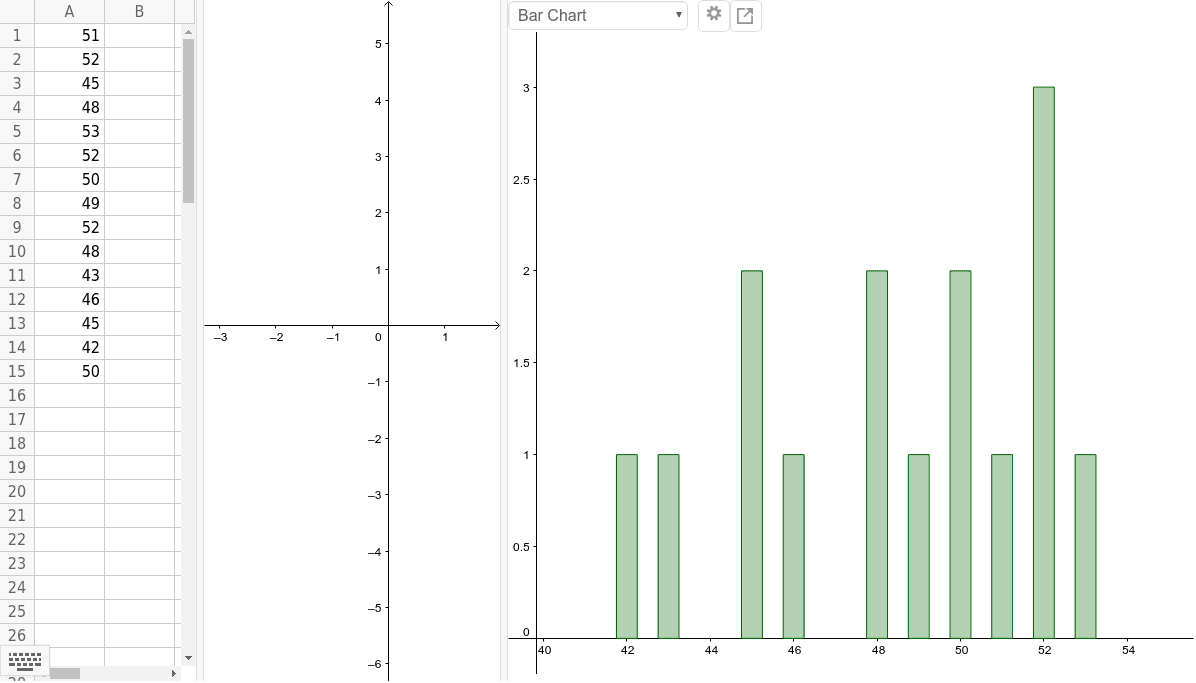
This example demonstrates the integration of histogram statistics with plane geometry. Core concepts include probability and statistics (histograms, percentages), geometry (angles, equilateral triangles), and trigonometry (sine). Construction involves creating multiple objects (A1-A15), utilizing translation transformations, and applying trigonometric functions. Suitable for high school mathematics, illustrating the connection between data distribution and geometric properties.
GeoGebra Commands & Parameters
515245485352504952484346454250
AI Drawing Prompt Reference
Create a histogram and geometric transformations example. First, plot a series of data points and draw a histogram to show the data distribution. Then, use translation transformations to create multiple equilateral triangles and adjust their angles with the sine function. Finally, connect these triangles to form a geometric shape, illustrating the relationship between data distribution and geometric properties.
The prompt above was compiled from the original drawing commands and is for reference only.