
H13 Linear Equations: Intersection and Secant Visualization
Loading the math board and drawing, please wait…
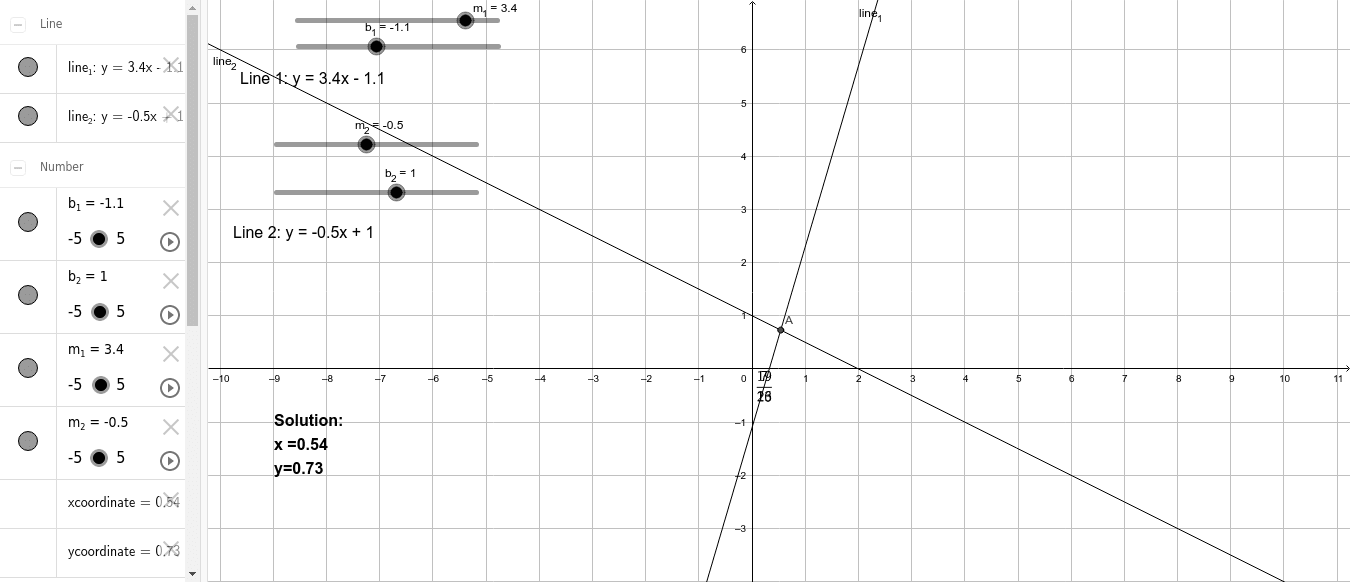
This GeoGebra example dynamically demonstrates the intersection of two linear equations (straight lines) and connects the concept of a secant line to function graphs. Core mathematical concepts include the standard form of linear equations (y = mx + b), slope and intercept, coordinates of the intersection point of two lines, and the geometric meaning of a secant line on a function graph. Construction highlights: the Intersect command is used to find the intersection point A of the two lines, and SurdText displays the coordinates in exact radical form as text; objects include m_1, b_1, line_1, text1, m_2, b_2, line_2, text2, as well as the x-coordinate, y-coordinate of A, and text3 for labeling. Suitable for middle and high school students learning systems of linear equations, function graphing, and coordinate geometry, and useful for teachers demonstrating dynamic changes of line intersections and secant concepts in class.
GeoGebra Commands & Parameters
Intersect(line_1, line_2) → ASurdText(xcoordinate) → x_1SurdText(ycoordinate) → y_1