
GeoGebra Example: Fractions and Attached Text
Loading the math board and drawing, please wait…
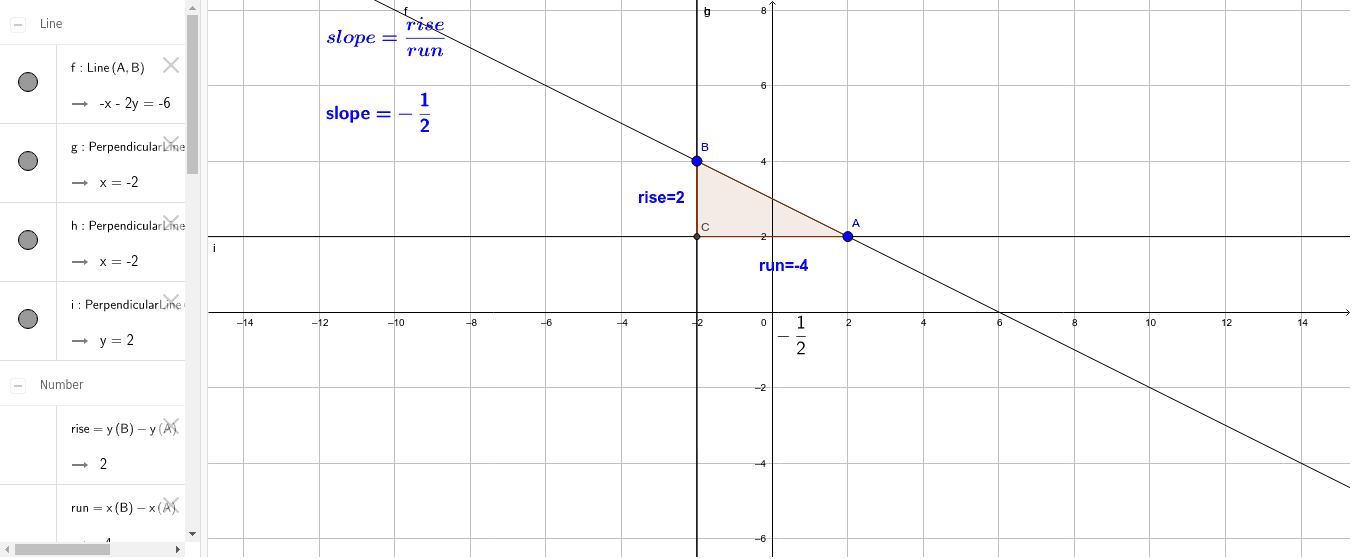
This example demonstrates how to use GeoGebra to create geometric figures incorporating fractions and attached text. It involves core mathematical concepts such as fraction representation, area calculation, confidence intervals, scalene triangles, integers, and number operations. Key construction steps include using commands like Line, OrthogonalLine, Intersect, Polygon, SurdText, and Midpoint. Suitable for high school mathematics teaching or self-study, it illustrates the integration of geometric construction with data analysis.
GeoGebra Commands & Parameters
Line(A, B) → fOrthogonalLine(B, xAxis) → hOrthogonalLine(B, xAxis) → gOrthogonalLine(A, yAxis) → iIntersect(i, h) → CPolygon(A, C, B) → poly1, b, a, cSurdText(slope) → slope_1Midpoint(a) → EMidpoint(b) → D
AI Drawing Prompt Reference
Draw a coordinate plane with a point on the x-axis and another point on the y-axis. Connect these two points with a slanted line. From the x-axis point, draw a vertical line upward; from the y-axis point, draw a horizontal line to the right; these two lines intersect at a third point, forming a right triangle. Connect the three vertices to create the triangle, and label the lengths of all three sides. Mark the midpoints of the two legs inside the triangle. Additionally, display the slope of the hypotenuse as a surd text near the figure.
The prompt above was compiled from the original drawing commands and is for reference only.