
Guessing the Population from the Sample: Interactive Histogram Demo
Loading the math board and drawing, please wait…
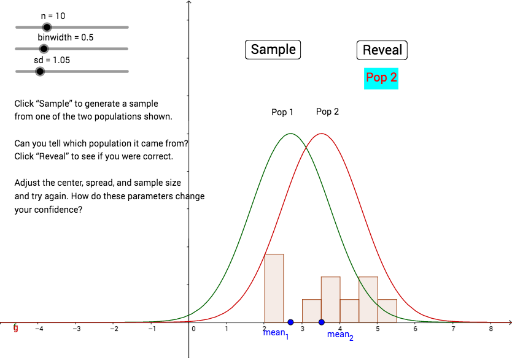
This GeoGebra example demonstrates how to infer population characteristics from a random sample using an interactive histogram. It covers core statistical concepts such as hypothesis testing, sample statistics (mean, standard deviation), population parameter estimation, and sampling variability. The construction uses commands like Random, Point, Sequence, Min, Max, and Histogram to generate sample data and plot the distribution. Sliders (e.g., binwidth) allow adjusting bin size, while buttons (button1, button2) trigger resampling or toggle display options. Text objects dynamically show computed statistics. Suitable for high school or introductory college statistics courses, this tool helps students visualize sampling error and the logic of statistical inference.
GeoGebra Commands & Parameters
Random(0, 1) → popPoint(xAxis) → BPoint(xAxis) → ASequence(RandomNormal[If[pop ≟ 0, x(A), x(B)], If[pop ≟ 0, sd, sd]], i, 1, n) → list1Min(list1) → minSequence(min + (i * binwidth), i, 0, bins) → boundsMax(f, 0, 15) → EMax(g, 0, 15) → FRandom(0, 1) → pop_1Random(0, 1) → pop_2Histogram(bounds, list1, true, 0.03) → a
AI Drawing Prompt Reference
Create an interactive histogram demo showing how to infer population characteristics from a sample. Include a horizontal axis with two draggable points representing possible population means. Generate a random sample based on these points and display its histogram, with bin width adjustable via a slider. Show sample statistics like mean and standard deviation as dynamic text. Add buttons to resample or toggle display options. The layout should be clean and educational, emphasizing sampling variability and statistical inference.
The prompt above was compiled from the original drawing commands and is for reference only.