
Graphs of y=A sin[B(x-C)]+D: Transformations of Sine Functions
Loading the math board and drawing, please wait…
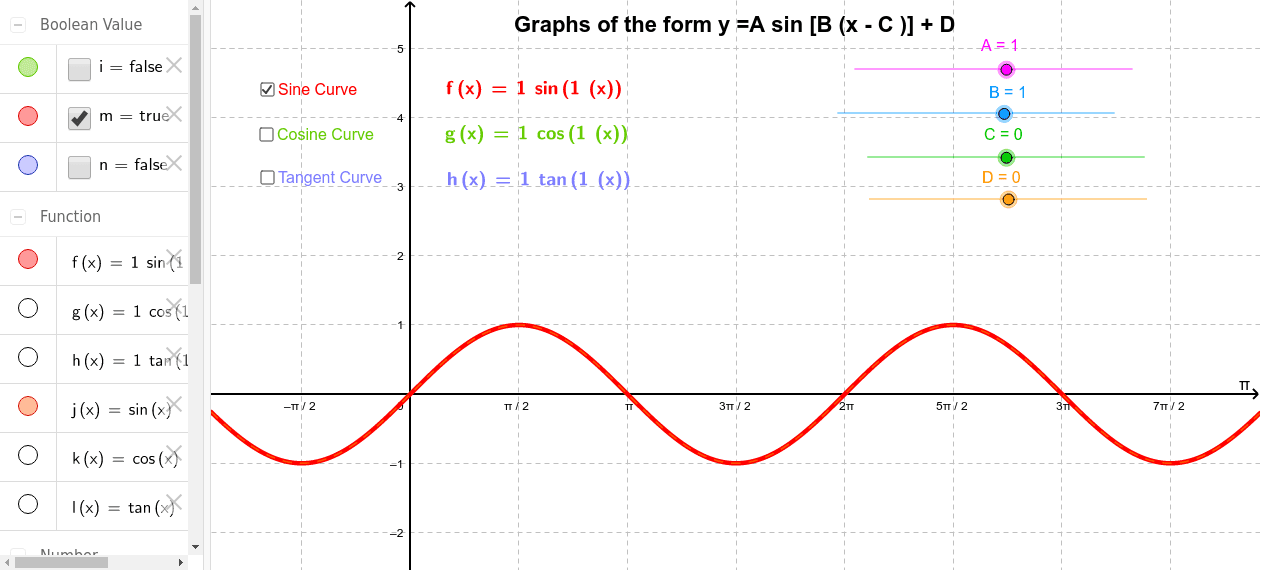
① This example dynamically illustrates the general sine function y=A sin[B(x-C)]+D, showing how parameters A, B, C, and D affect the graph's amplitude, period, phase shift, and vertical translation. ② Core mathematical concepts include trigonometric functions, horizontal and vertical translations, amplitude and period scaling, and reflection transformations of function graphs. ③ Construction details: The GeoGebra commands include LaTeX for formula text, with objects A, B, C, D as parameters, and multiple functions (f, g, h, h_1, i, j, k, l, m, n) along with text labels (text1, text2, text6) to display values. Sliders or input fields likely control the parameters, updating the graph in real time. ④ Suitable for high school trigonometry, pre-calculus, or function transformation lessons, ideal for classroom demonstrations or student-led exploration of how each parameter alters the sine curve.
GeoGebra Commands & Parameters
LaTeX(g, true, true) → text1LaTeX(f, true, true) → text6LaTeX(h, true, true) → h_1
AI Drawing Prompt Reference
Draw a dynamic illustration showing the transformation of the sine function y=A sin[B(x-C)]+D, including multiple function curves. Use sliders to control parameters A, B, C, D, and display in real-time how each parameter affects amplitude, period, phase shift, and vertical translation. Label the formulas and parameter values.
The prompt above was compiled from the original drawing commands and is for reference only.