
Graphs of Power Functions by Venkat
Loading the math board and drawing, please wait…
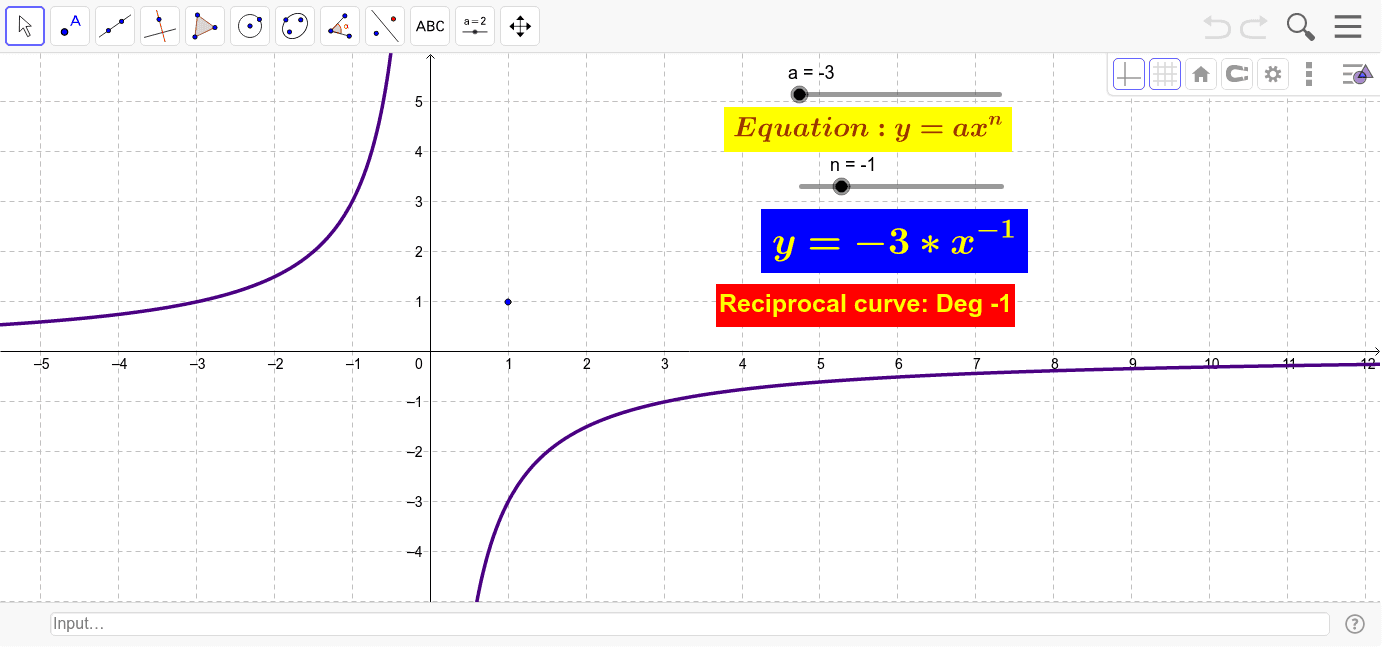
This example demonstrates the graphs of power functions y=ax^n where n=0,1,2,3,-1,-2, with a being positive or negative. It covers core math concepts like power function properties, graph transformations, and parameter effects. Constructed using GeoGebra objects: a (parameter), n (parameter), f (function), text1-text8 (texts), A (point). Suitable for high school mathematics education to understand power function graph characteristics and parameter influence.
GeoGebra Commands & Parameters
Numeric a(-3.0)Numeric n(-1.0)f(x) = (a * x^(n))Point A(1.0, 1.0)