
Graphs of Exponential Functions
Loading the math board and drawing, please wait…
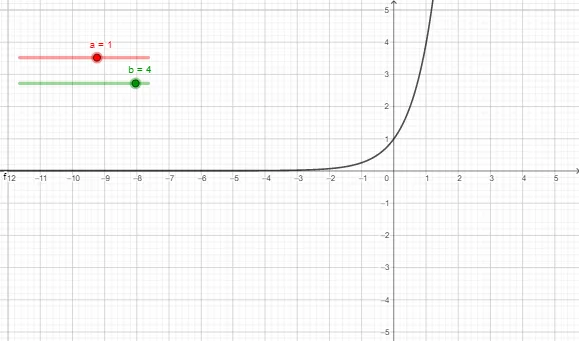
This example demonstrates the graphs of exponential functions. It involves the core mathematical concepts of exponential functions and their graph characteristics. By adjusting parameters a and b, you can observe changes in the graph of the exponential function. This example uses GeoGebra objects a, b, and function f. Suitable for high school mathematics education and learning.
GeoGebra Commands & Parameters
Numeric a(1)Numeric b(4)f(x) = (a * b^(x))
AI Drawing Prompt Reference
Draw a graph of an exponential function with a base of 4 and a coefficient initially set to 1. The curve should pass through the point (0,1) and rise steeply as x increases. Include two draggable sliders: one for the coefficient (starting at 1) and one for the base (starting at 4). Adjusting the sliders changes the curve's shape accordingly. Show clear coordinate axes with labeled ticks, a smooth curve, and the function expression displayed. Keep the style clean and suitable for high school math teaching.
The prompt above was compiled from the original drawing commands and is for reference only.