
Graphs and Properties of Sine and Cosine Functions
Loading the math board and drawing, please wait…
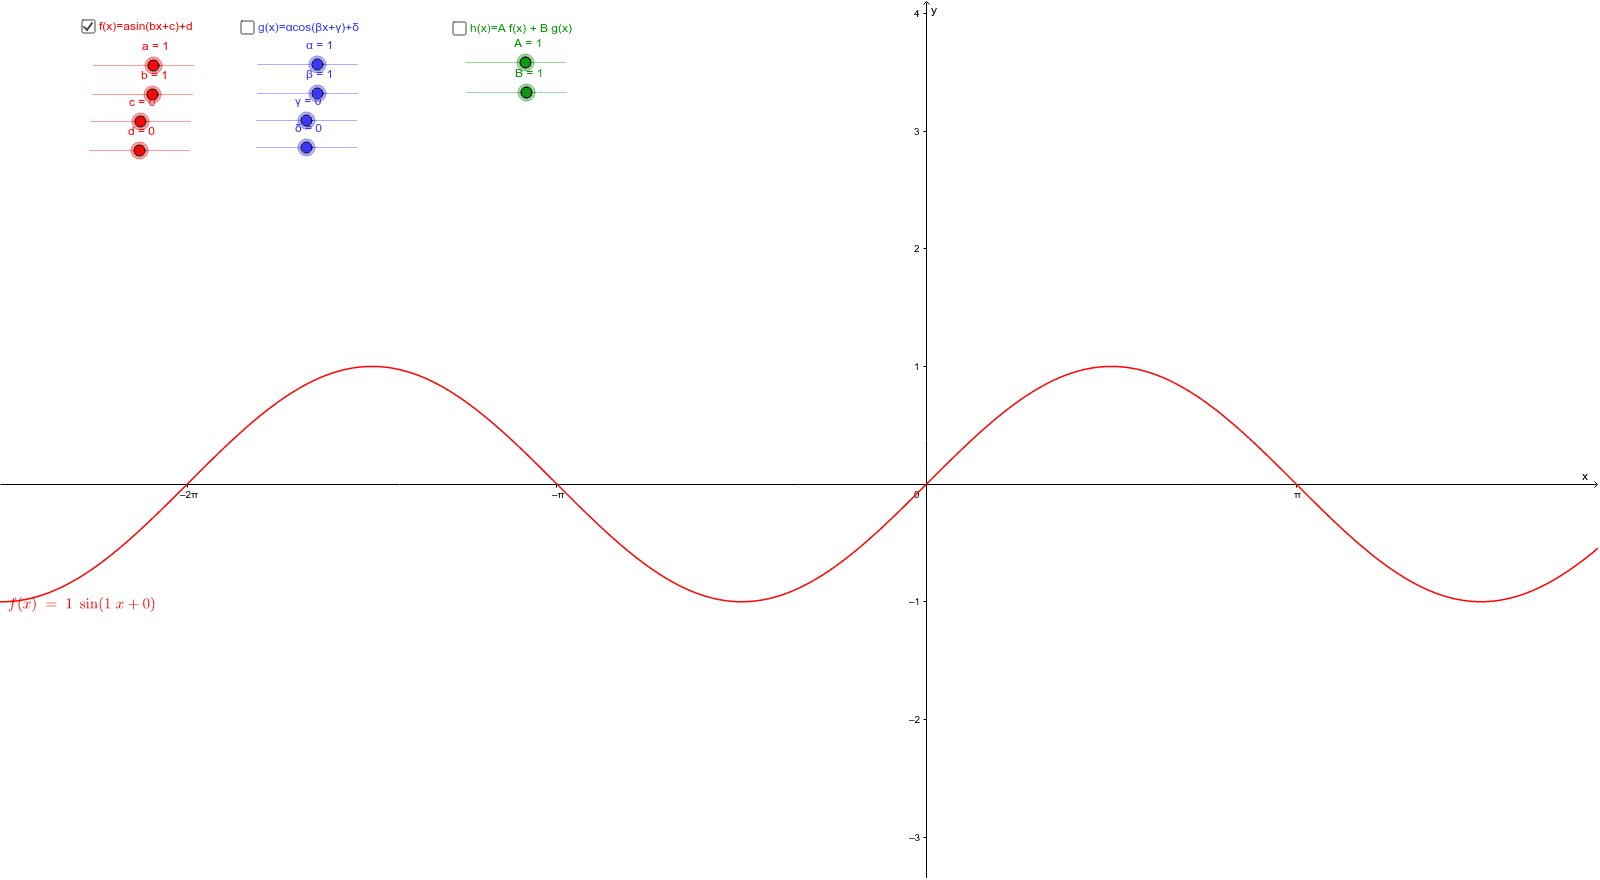
By adjusting parameters, students can visually understand the graphs and concepts of amplitude, period, and phase of sine and cosine functions. This example uses GeoGebra's slider animation feature to allow interactive exploration of these basic trigonometric function properties. Suitable for high school mathematics education and learning.
GeoGebra Commands & Parameters
Numeric a(1.0)Numeric b(1.0)Numeric c(-7.963267948964958E-4)Numeric d(0.0)Numeric α(1.0)Numeric β(1.0)Numeric γ(-7.963267948964958E-4)Numeric δ(0.0)f(x) = a * sin(b * x + c) + dg(x) = α * cos(β * x + γ) + δNumeric A(1.0)Numeric B(1.0)h(x) = A * f(x) + B * g(x)Boolean e(true)Boolean i(false)Boolean j(false)
AI Drawing Prompt Reference
Draw the graphs of two sine and cosine functions, adjusting their amplitudes, periods, and phases with sliders to observe their variations, and then combine them linearly to compare their properties.
The prompt above was compiled from the original drawing commands and is for reference only.