
Graphing Two-Step Equations
Loading the math board and drawing, please wait…
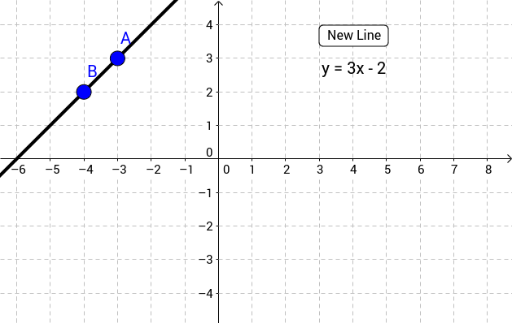
① This example demonstrates how to visualize a two-step linear equation (e.g., ax + b = c) by graphing its corresponding straight line, linking algebraic solving to geometric representation. ② Core mathematical concepts include linear equations, slope and intercept, coordinate plane graphing, and interpreting the solution as the intersection point with the x-axis or another line. ③ Construction details: The GeoGebra commands use the Line tool to create lines a and b, with points A and B defining key positions, while button1 and text1/text2 provide interactive step-by-step feedback, showing how each algebraic operation (addition/subtraction, multiplication/division) corresponds to a geometric transformation such as shifting or scaling the line. ④ Suitable for middle school students learning the connection between equations and graphs, and for teachers demonstrating the visual meaning of solving two-step equations in a dynamic classroom setting.
GeoGebra Commands & Parameters
Line(A, B) → b
AI Drawing Prompt Reference
Draw two lines in a coordinate system to visualize a two-step linear equation, highlighting the intersection with the x-axis as the solution. Use sliders to show how algebraic transformations correspond to geometric changes like shifting or scaling the lines, linking operations to visual effects.
The prompt above was compiled from the original drawing commands and is for reference only.