
Graphing the Tangent Function
Loading the math board and drawing, please wait…
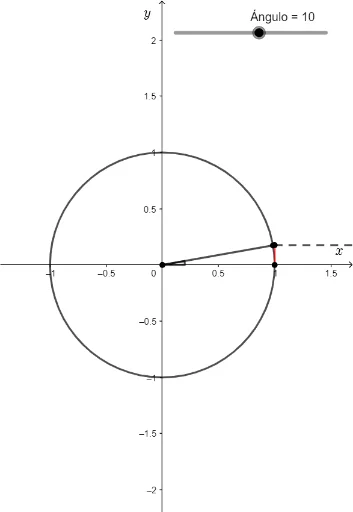
This example demonstrates the graph of the tangent function f(x)=tan(x), highlighting its properties such as periodicity, asymptotes, and odd symmetry. It involves key mathematical concepts in trigonometry and calculus. The construction utilizes GeoGebra commands like Intersect, Circle, Segment, and Angle to illustrate these features effectively, making it suitable for high school students studying trigonometric functions and their graphs.
GeoGebra Commands & Parameters
Intersect(xAxis, yAxis) → ACircle(A, 1) → fSegment(A, B) → ABAngle(xAxis, AB) → αSegment(B, C) → BCSegment(C, D) → CDSegment(E, F) → EFSegment(E, H) → EHSegment(C, G) → CGAngle(AB, xAxis) → β
AI Drawing Prompt Reference
Draw the graph of the tangent function, highlighting its periodicity, asymptotes, and odd symmetry. Start by marking the intersection of the x-axis and y-axis as point A, then draw a unit circle f centered at A. Next, mark the intersection of the unit circle and the x-axis as point B, and draw segment AB to form angle α. Then, mark the intersection of the unit circle and the y-axis as point C, and draw segments BC and CD. Finally, draw points E and F, and connect EF and EH, and then connect C and G to form angle β.
The prompt above was compiled from the original drawing commands and is for reference only.