
Area Under a Curve by menchublancodelprado
Loading the math board and drawing, please wait…
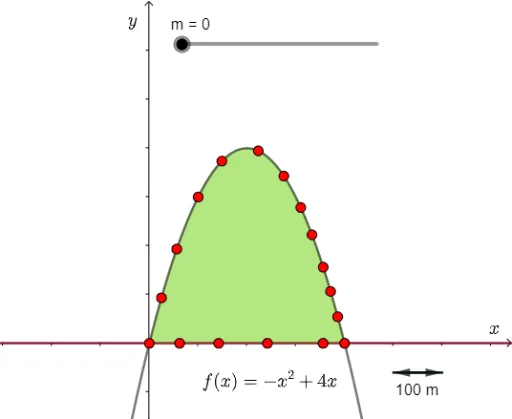
This example demonstrates how to plot and calculate the area under a curve using GeoGebra. Key math concepts include definite integrals, function graphs, similarity transformations, and geometric constructions. It utilizes commands like Intersect, IntegralBetween, Integral, Point, Segment, and Vector as per the construction summary. Suitable for high school and above students learning advanced calculus and geometric transformations.
GeoGebra Commands & Parameters
Intersect(f, g) → A, BIntegralBetween(f, g, 0, X) → aIntegral(f, 0, 4) → dPoint(f) → DPoint(f) → EPoint(f) → FPoint(f) → GPoint(f) → HPoint(f) → IPoint(f) → JPoint(f) → KPoint(f) → LPoint(f) → MPoint(f) → NIntersect(f, xAxis, 2) → OPoint(xAxis) → PPoint(xAxis) → QPoint(xAxis) → RPoint(xAxis) → SSegment(T, U) → hPoint(h) → VPoint(h) → WVector(V, W) → uPoint(h) → ZPoint(h) → A_1Vector(Z, A_1) → v
AI Drawing Prompt Reference
Draw a function curve and a line intersecting at two points. Shade the region between the curve and the line from x=0 to one intersection point to represent a definite integral. Also shade another region under the curve from x=0 to 4. Place several points on the curve and several on the x-axis. Connect two points on the x-axis to form a segment, then place two points on that segment and create a vector between them, and similarly create another vector from two other points on the segment. Show the relationship among the function, integral areas, and geometric constructions.
The prompt above was compiled from the original drawing commands and is for reference only.