
Graphing the Tangent Function by Brian Sterr
Loading the math board and drawing, please wait…
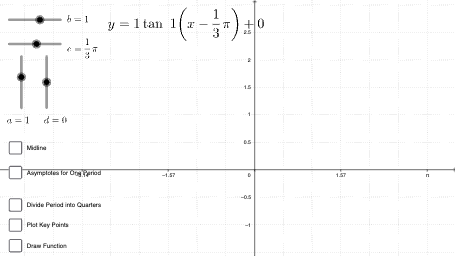
This example demonstrates the graphing of the tangent function. The tangent function is a trigonometric function with periodic and asymptotic characteristics. Using GeoGebra commands such as Sequence and objects a, c, d, b, n, k, text2, text3, text5, h, g, i, j, l, m, p, text4, text6, q, r, C, D, E, list1, f, text1, the graph of the tangent function can be dynamically displayed. Suitable for high school mathematics education and learning.
GeoGebra Commands & Parameters
Sequence(x = (c * pi) - n / 2 + (n * t / 4), t, 1, 3) → list1