
Graphing the Sine Function
Loading the math board and drawing, please wait…
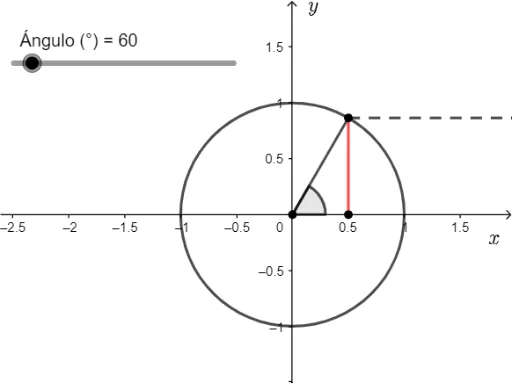
This example demonstrates how to graph the sine function f(x)=sin(x). Key math concepts include trigonometry, coordinate systems, and function graphs. Construction highlights using GeoGebra commands/objects: Intersect, Circle, Segment, Angle, Point, Vector. Suitable for high school students learning function graphing and sine properties.
GeoGebra Commands & Parameters
Intersect(xAxis, yAxis) → ACircle(A, 1) → fSegment(A, B) → ABSegment(B, C) → BCAngle(xAxis, AB) → αSegment(D, E) → DESegment(B, F) → BFSegment(D, G) → DGPoint(yAxis) → IVector(H, I) → uVector(H, J) → v
AI Drawing Prompt Reference
Draw the graph of the sine function by first plotting the intersection of the x and y axes, then drawing a unit circle centered at this point. Next, draw a line segment from the center to the circle, and another perpendicular to the x-axis from the point on the circle. Measure the angle between this segment and the x-axis. Finally, draw two vectors from the center, one along the positive x-axis and the other along the positive y-axis, and connect the points where these vectors intersect the unit circle to visualize the sine function.
The prompt above was compiled from the original drawing commands and is for reference only.