
Graphing the Inverse of a Logarithm
Loading the math board and drawing, please wait…
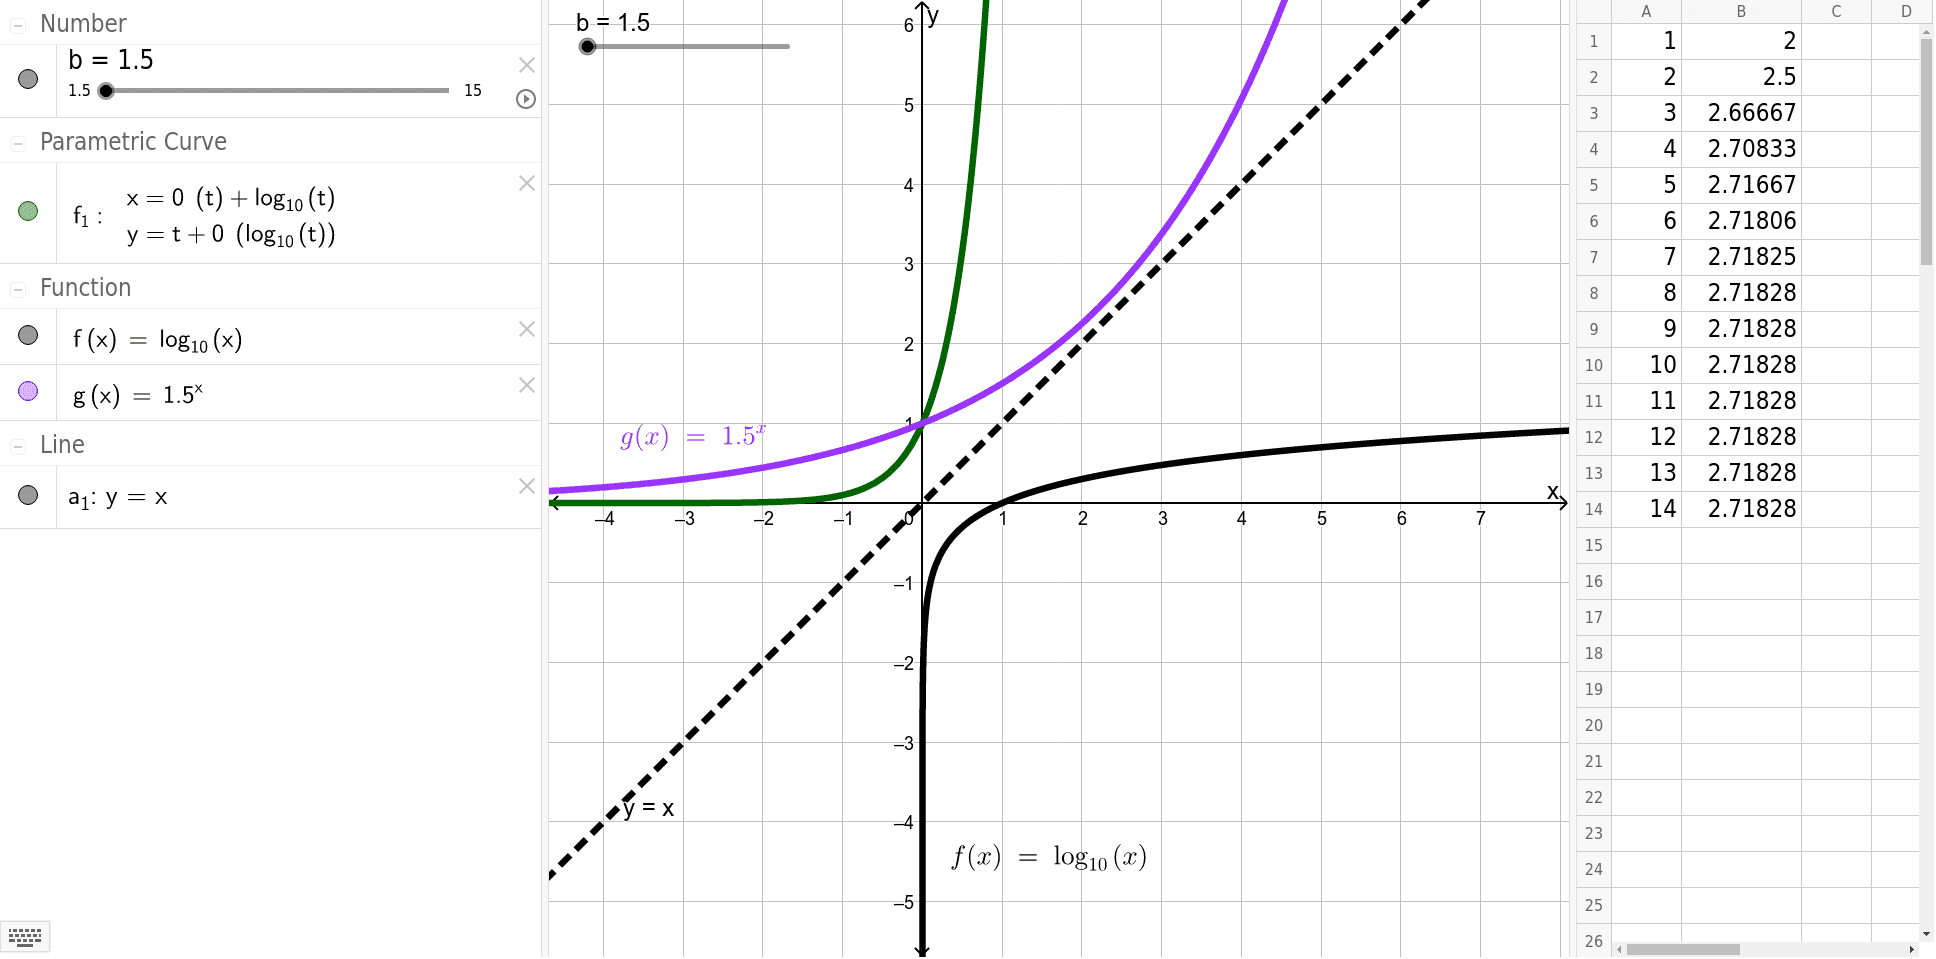
This example demonstrates how to graph the inverse of a base 10 logarithm by reflecting the function across the line y=x in GeoGebra. Key math concepts include inverse functions, logarithmic functions, geometric reflection, and coordinate systems. The construction uses commands like Mirror and involves objects such as the function f, parameter a_1, the inverse function f_1, point b, and multiple points A1-A14 and B1-B14. It is suitable for high school students learning about the geometric interpretation of inverse functions and graphing techniques in analytical geometry.
GeoGebra Commands & Parameters
Mirror(f, a_1) → f_1
AI Drawing Prompt Reference
Draw the graph of a logarithmic function and reflect it across the line y=x to obtain its inverse function. Key objects include the original function f, parameter a_1, the reflected inverse function f_1, and point b. The construction order is to first draw f, then reflect it to get f_1, and finally display both images in the coordinate system.
The prompt above was compiled from the original drawing commands and is for reference only.