
Graphing Systems of Linear Equations by Andrew Elmer
Loading the math board and drawing, please wait…
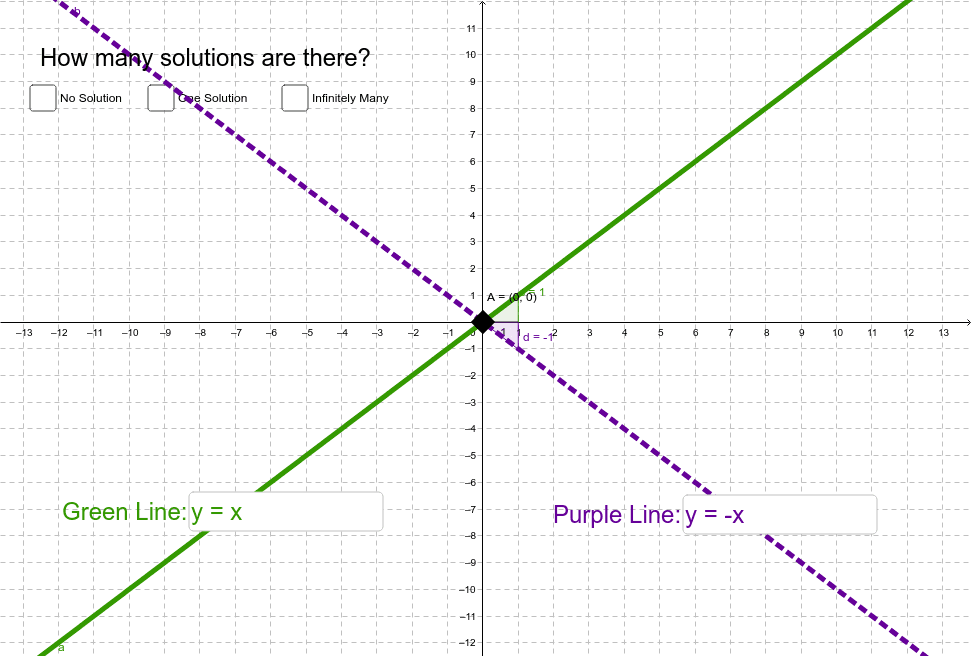
This applet allows users to graph systems of linear equations and explore the three possible solution types: no solution, one solution, or infinitely many solutions. Key mathematical concepts include linear equations, slope, and coordinate geometry. The construction leverages GeoGebra commands like Intersect, Textfield, and Slope, along with objects such as a, b, A, Green, Purple, c, d, one, Solutions, None, none, Infinite, infinite, O, One, Correct, Yes, No, yes, no. Ideal for high school mathematics education to visually understand the determination and properties of solutions to linear systems.
GeoGebra Commands & Parameters
Intersect(a, b) → ATextfield(a) → GreenTextfield(b) → PurpleSlope(a) → cSlope(b) → d
AI Drawing Prompt Reference
Draw two lines, one in green and one in purple, and calculate their slopes. Use these slopes to draw two more lines. Among these three lines, one intersects the original two at a single point, while the other two do not intersect. Mark the intersection points with different colors and label the lines to indicate the three possible solution types: no solution, one solution, and infinitely many solutions.
The prompt above was compiled from the original drawing commands and is for reference only.