
Graphing Standard-Form Linear Equations
Loading the math board and drawing, please wait…
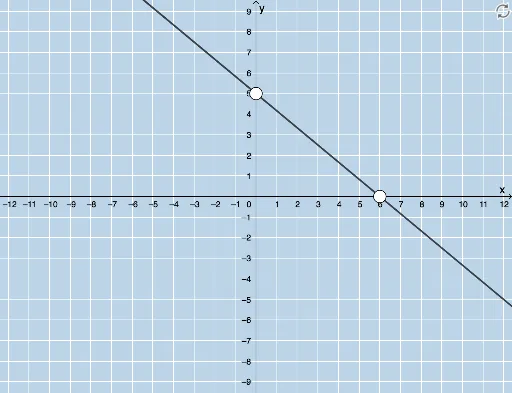
This example demonstrates how to graph linear equations written in standard form on the coordinate plane, turning an algebraic relationship into its geometric interpretation (a straight line). It focuses on key concepts such as linear equations, the standard form of a line (ax + by = c style constraints), and the connection between coordinate geometry and graphing. The construction uses GeoGebra commands including Random to generate parameters and LCM to align/scaffold numerical relationships, and Line to create the corresponding linear graph. It assembles the resulting geometric objects (parameters like a, b, c, k, d, f and related points/labels such as A, B, g, e) together with text elements (text1/text2/text3) and buttons (button1/button2) for an interactive visualization. Suitable for secondary school and early undergraduate learners studying coordinate geometry and the graphical meaning of linear equations.
GeoGebra Commands & Parameters
Random(-6, 6) → aRandom(-6, 6) → bLCM(a, b) → cRandom(1, 4) → kLine(A, B) → g
AI Drawing Prompt Reference
On a coordinate plane, create a linear graph by first randomly choosing two integer parameters to act as the line’s coefficients, then computing their least common multiple to obtain a third parameter for the standard-form linear constraint. Also randomly pick a positive integer parameter to specify the related value used in the construction. Finally draw the straight line determined by the resulting standard-form relationship and include text annotations that summarize the parameter choices, forming an interactive style visualization connecting the algebraic equation to its geometric graph.
The prompt above was compiled from the original drawing commands and is for reference only.