
Graphing Square Root Functions with Parameters
Loading the math board and drawing, please wait…
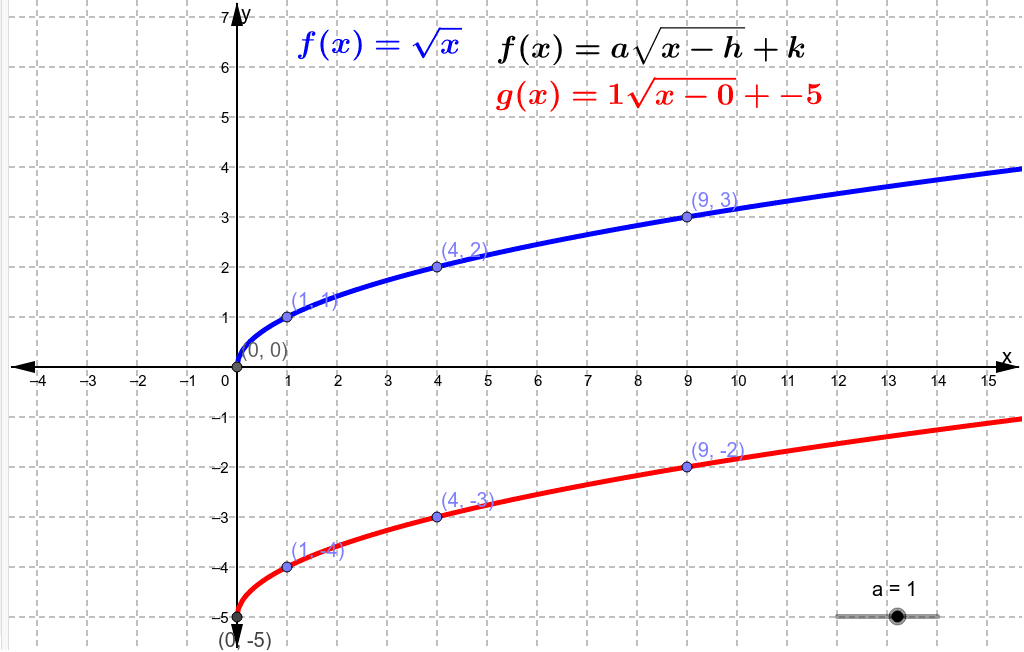
This GeoGebra worksheet demonstrates graphing the square root function y=a√(x-h)+k and explores how parameters affect the function's graph. Core mathematical concepts covered include: definition and range of square root functions, translation and dilation of function graphs, and the effects of parameters a (dilation coefficient), h (horizontal shift), and k (vertical shift) on the graph. Construction details: Using Point command to create draggable control points, slider objects a, h, k for dynamic parameter adjustment, text objects to display function expressions, and function objects f and g to represent original and transformed functions. Suitable for middle school to high school mathematics teaching, ideal for function concept instruction, function transformation exploration, and mathematical experiment activities.
GeoGebra Commands & Parameters
Point(f) → APoint(f) → BPoint(f) → CPoint(f) → DPoint(g) → EPoint(g) → FPoint(g) → GPoint(g) → H
AI Drawing Prompt Reference
Draw a graph of a square root function with adjustable parameters. Show the base curve y=√x and a transformed version y=a√(x-h)+k. Place four draggable points on each curve to mark specific locations. Include three sliders to control the values of a, h, and k, and display the current function formula. The layout should be clean and educational, emphasizing how changing parameters shifts or stretches the graph.
The prompt above was compiled from the original drawing commands and is for reference only.