
Graphing Square and Cube Root Functions
Loading the math board and drawing, please wait…
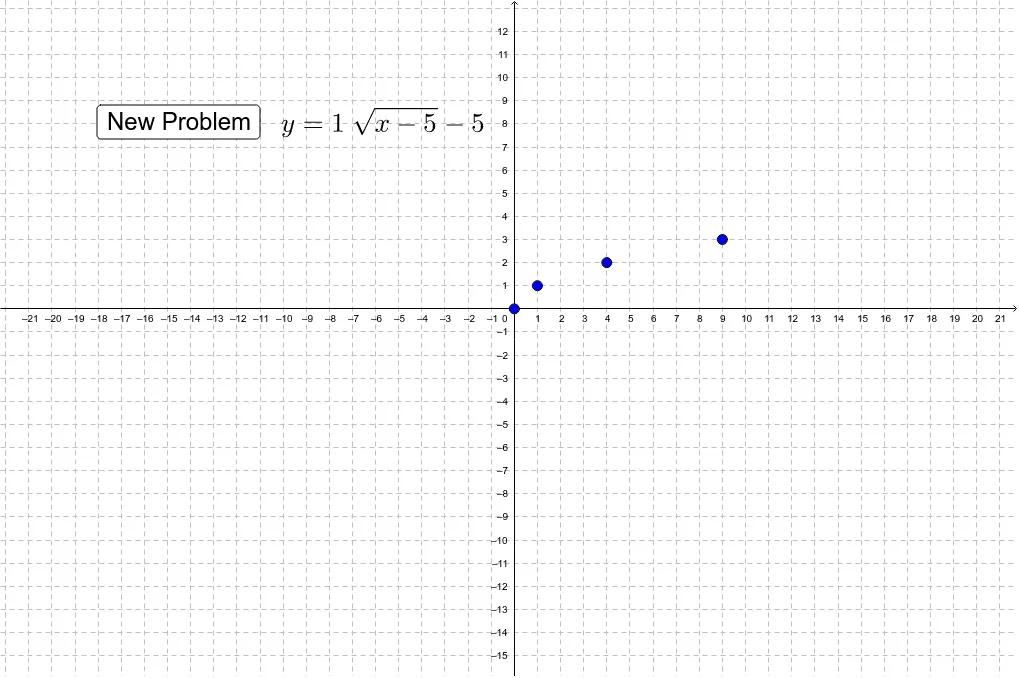
This example demonstrates how to graph square and cube root functions by manipulating points. It involves core math concepts like function graphs, square root functions, cube root functions, and coordinate geometry. GeoGebra commands and objects used include a, h, k, A, f, b, c, d, B, C, D, g, e, i, j, E, I, J, text1, text2, list1, r, list2, button1, A_1, B_1, C_1, D_1, E_1, I_1, J_1, F, G, pic1, H, K, pic2, list3. Suitable for middle school and above students learning function graphs and their properties.
GeoGebra Commands & Parameters
Numeric a(1.0)Numeric h(-5.0)Numeric k(-5.0)((-h), k)f(x) = (a * sqrt(x + h)) + k1 - h4 - h9 - h(b, a + k)(c, (2 * a) + k)(d, (3 * a) + k)g(x) = (a * (x + h)^(1 / 3)) + k-1 - h8 - h-8 - h(e, (-1 * a) + k)(i, (2 * a) + k)(j, ((-2) * a) + k){1, 2}Numeric r(1.0){-5, -4, -3, -2, -1, 1, 2, 3, 4, 5}Point A_1(0.0, 0.0)Point B_1(1.0, 1.0)Point C_1(4.0, 2.0)Point D_1(9.0, 3.0)Point E_1(-1.0, -1.0)Point I_1(8.0, 2.0)Point J_1(-8.0, -2.0)Point F(-6.296265687915755, 9.134182652109242)Point G(-4.65647368791576, 9.075618652109242)Point H(4.007323775260301, 8.611122954292856)Point K(5.969217775260301, 8.611122954292856){-3, -2, -1, 1, 2, 3}
AI Drawing Prompt Reference
Draw a graph of square root and cube root functions. Start by setting parameter a to 1 and h to -5, k to -5. Then, plot points A(-5, -5) and B(1, 1), C(4, 2), D(9, 3) to represent key points of the square root function f(x) = a * sqrt(x + h) + k. Next, plot points E(-1, -1), I(8, 2), J(-8, -2) to represent key points of the cube root function g(x) = a * (x + h)^(1/3) + k. Finally, connect these points to form the function graphs.
The prompt above was compiled from the original drawing commands and is for reference only.