
Graphing Slope and Intercept Form
Loading the math board and drawing, please wait…
In collections
UNIT 2 LINEAR FUNCTIONS
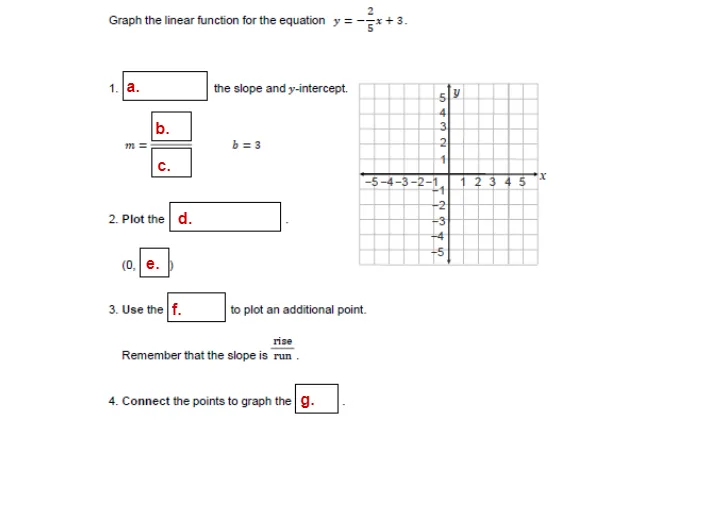
This example demonstrates how to plot functions using slope and intercept form. Key mathematical concepts include linear functions, slope calculation, and intercept determination. Construction involves using GeoGebra commands to create points, draw lines, and label parameters. Suitable for middle or high school math courses to understand the relationship between function graphs and lines.
GeoGebra Commands & Parameters
Point A(-5.174, -4.096)Point B(3.766, -4.096)
AI Drawing Prompt Reference
Draw two horizontal lines passing through the points (-5.174, -4.096) and (3.766, -4.096), and label their slopes and intercepts to demonstrate the graph of linear functions in slope-intercept form, illustrating how slope and intercept affect the position of the lines.
The prompt above was compiled from the original drawing commands and is for reference only.