
Graphing Sine & Cosine with Amplitude and Period
Loading the math board and drawing, please wait…
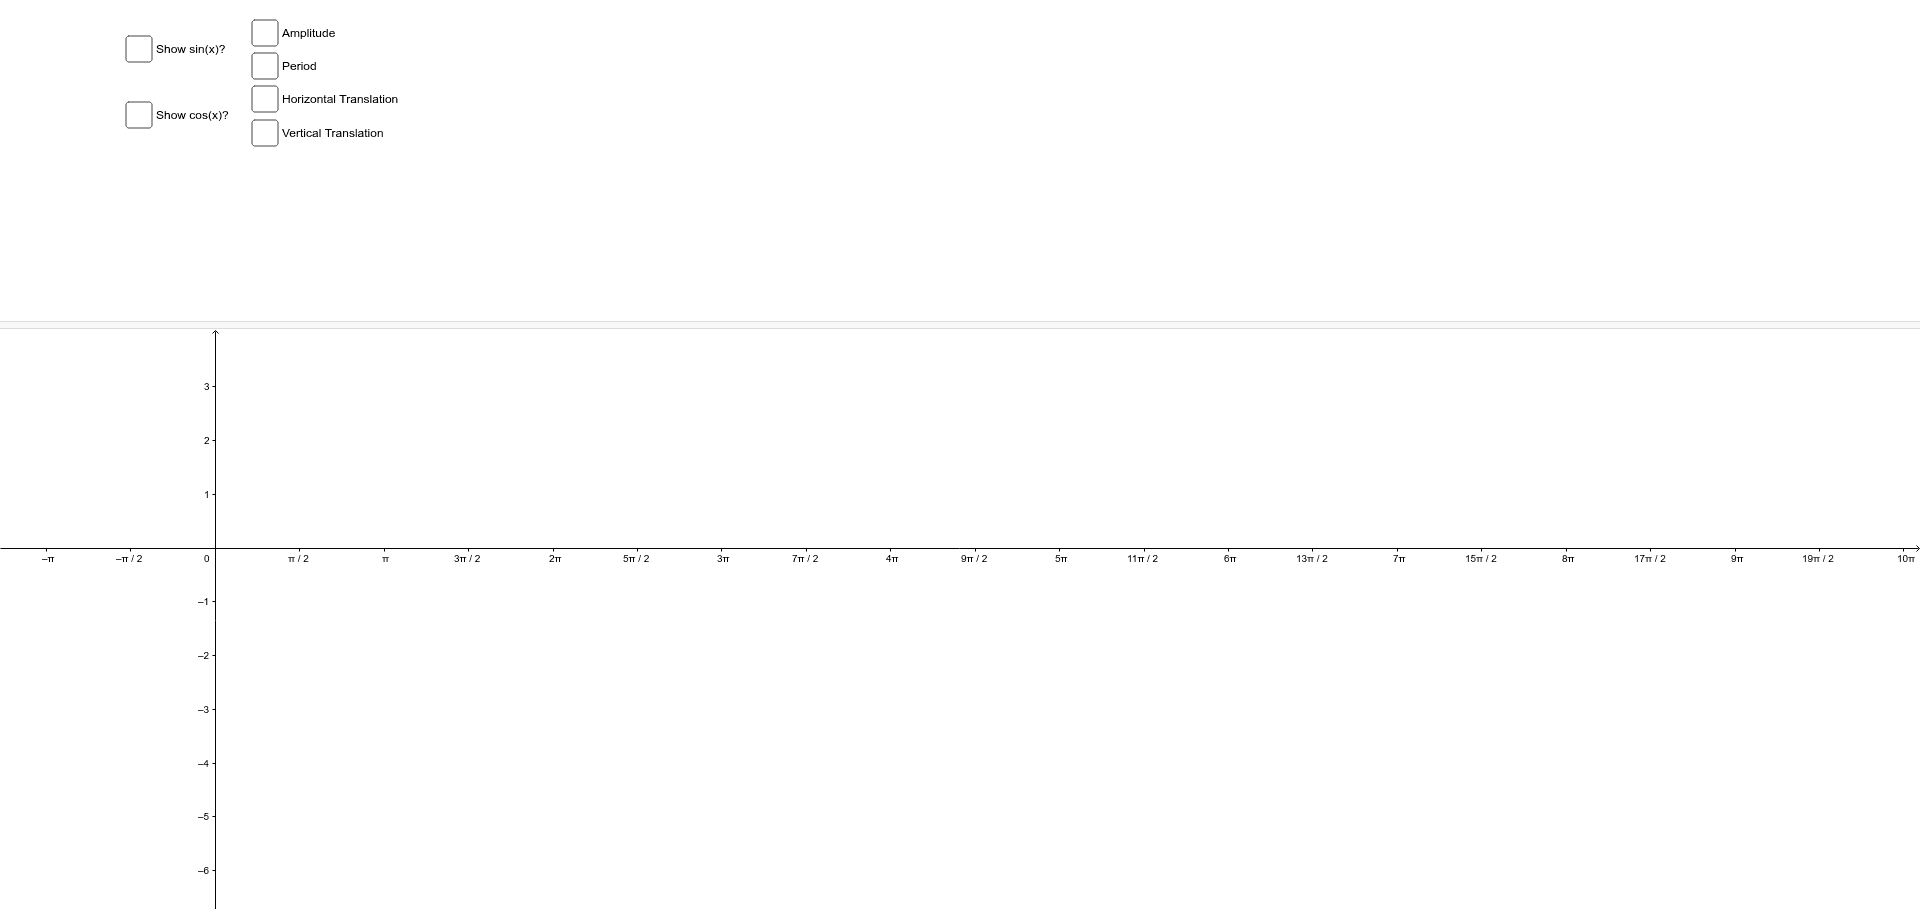
This example demonstrates how to graph sine and cosine functions by adjusting their amplitude and period. Key mathematical concepts include sine and cosine functions. By manipulating objects a, b, c, d, etc., one can observe the effects of amplitude and period changes on the function's graph. Suitable for high school mathematics education and learning.
GeoGebra Commands & Parameters
Numeric a(1.0)Numeric b(1.0)Numeric c(0.0)Numeric d(0.0)g(x) = d + (a * cos((b * x) - c))f(x) = d + (a * sin((b * x) - c))Boolean e(false)Boolean h(false)Boolean i(false)Boolean j(false)Boolean k(false)Boolean l(false)