
Graphing Sine and Cosine Function Transformations
Loading the math board and drawing, please wait…
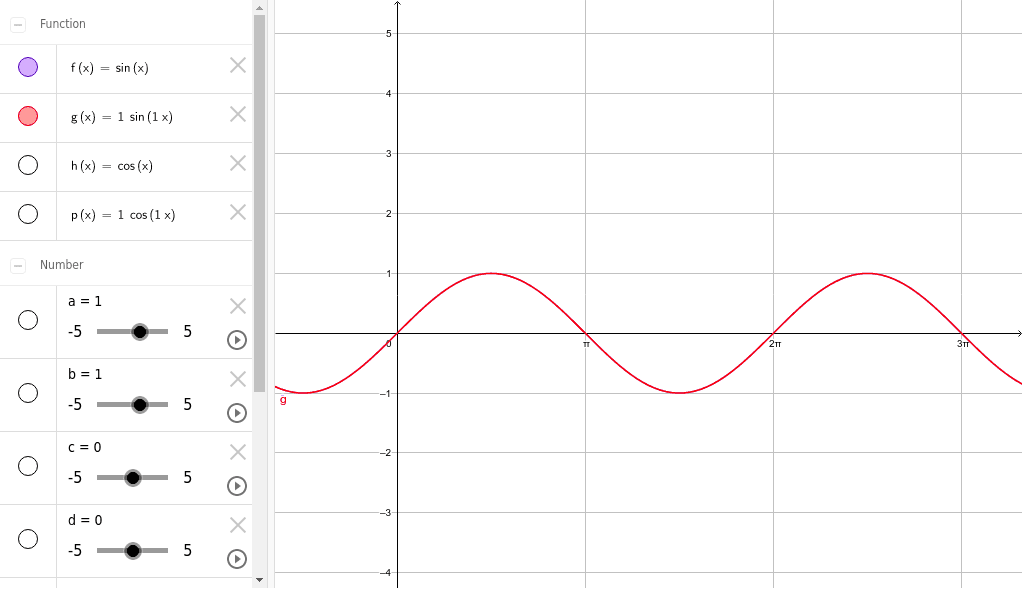
This example demonstrates the graph transformations of sine and cosine functions, including translations and scalings. It involves core math concepts like trigonometric functions, function graph transformations, amplitude, period, and phase shift. GeoGebra commands used include objects f (function), a,b,c (parameters), h,d (translations), and g,e,i,j,k (auxiliary objects), p (sliders). Suitable for high school mathematics education to understand the rules of trigonometric function graph transformations.
GeoGebra Commands & Parameters
f(x) = sin(x)Numeric a(1)Numeric b(1)Numeric c(0)h(x) = cos(x)0g(x) = (a * sin((b * x) + c)) + dNumeric e(1)Numeric i(1)Numeric j(0)Numeric k(0)p(x) = (e * cos((i * x) + j)) + k