
Graphing Simultaneous Equations
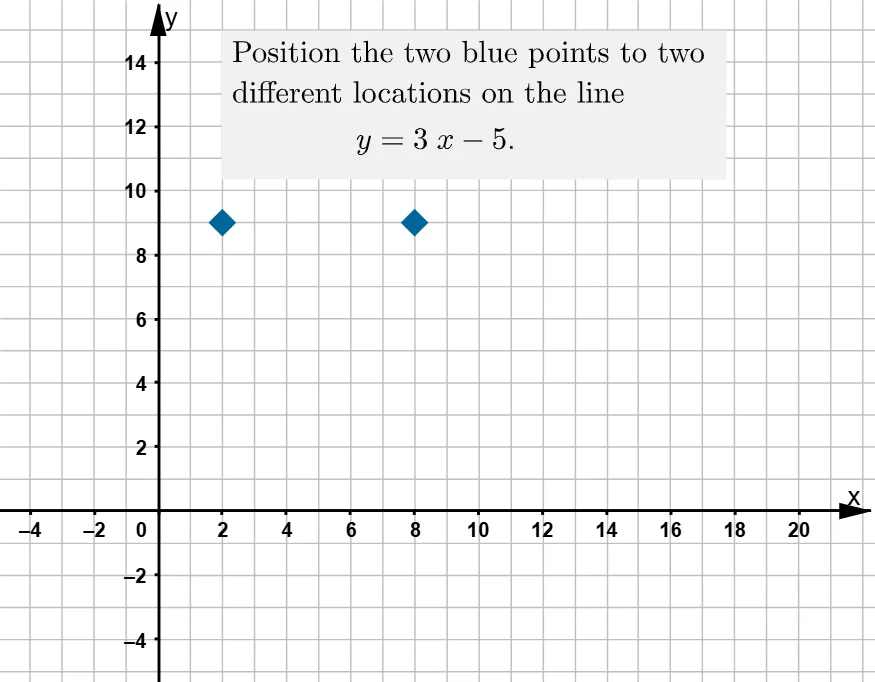
Loading the math board and drawing, please wait…
This example demonstrates solving simultaneous equations through graphical methods. Core math concepts include systems of equations, coordinate geometry, and intersection points. It utilizes GeoGebra commands like Random, RandomElement, Remove, Simplify, Textfield, Line, Text, and Intersect. Suitable for high school mathematics teaching or self-study to understand the geometric interpretation of solutions to systems of equations.
GeoGebra Commands & Parameters
Random(-1, 12) → aRandom(-1, 12) → bRandomElement(list1) → mRemove(list1, {m}) → list2RandomElement(list2) → nSimplify(f) → pSimplify(g) → qTextfield(empty) → InputBox1Textfield(empty2) → InputBox2Line(A, B) → hText(h) → text5Line(C, D) → iText(i) → text6Intersect(h, i) → F
AI Drawing Prompt Reference
Draw two random lines with different slopes that are neither parallel nor coincident in a coordinate system, and mark their intersection point. The coefficients of the line equations are randomly generated to ensure the intersection coordinates are integers. Label the equations of the two lines and the coordinates of the intersection point with text, to observe the relationship between the solution of the system of equations and the graph.
The prompt above was compiled from the original drawing commands and is for reference only.