
Graphing Quadratic Functions - Standard Form #1
Loading the math board and drawing, please wait…
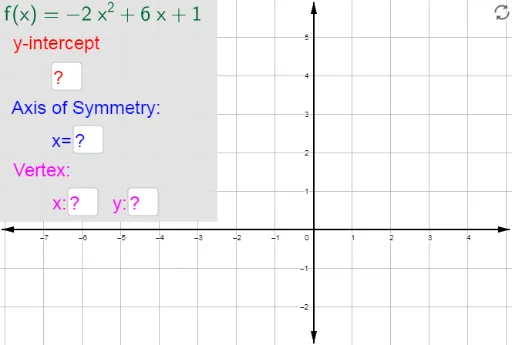
This example asks students to input the y-intercept, axis of symmetry, and vertex of the given function. It involves the core concept of quadratic functions, constructed using GeoGebra commands such as TextField and Polygon. Suitable for middle school and above students to learn about the graph and properties of quadratic functions.
GeoGebra Commands & Parameters
Textfield(a) → inputBox1Textfield(b) → inputBox2Textfield(c) → inputBox3Textfield(d) → inputBox4Polygon(G, H, I, J) → poly1, g_1, h, i, j
AI Drawing Prompt Reference
Draw a graph of a quadratic function in standard form, and place four blank input boxes on the canvas for entering the y-intercept, axis of symmetry, and vertex coordinates. Also add a rectangular region defined by four corner points to highlight or contain key features related to the function. Arrange the curve and these interactive elements clearly so that students can observe and fill in their answers.
The prompt above was compiled from the original drawing commands and is for reference only.