
Graphing Quadratic Functions - Intercept Form by Katie Drach
Loading the math board and drawing, please wait…
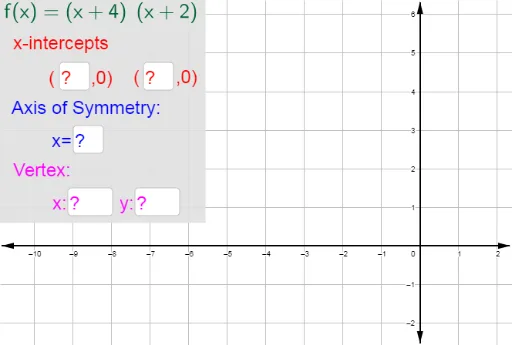
This example asks students to input the y-intercept, axis of symmetry, and vertex of the given function. Using GeoGebra commands, students can understand the basic properties of quadratic functions. This example is suitable for middle school math education, helping students grasp the graph and properties of quadratic functions.
GeoGebra Commands & Parameters
Textfield(a) → inputBox1_1Textfield(b) → inputBox2Textfield(c) → inputBox3Textfield(d) → inputBox4Polygon(G, H, I, J) → poly1, g_1, h, i, jTextfield(k) → inputBox1
AI Drawing Prompt Reference
Draw the graph of a quadratic function, with input boxes for the y-intercept, axis of symmetry, and vertex coordinates. Connect these points with a polygon and label the input boxes and vertex to illustrate the basic properties of the function.
The prompt above was compiled from the original drawing commands and is for reference only.