
Graphing Quadratic Functions - Intercept Form #17
Loading the math board and drawing, please wait…
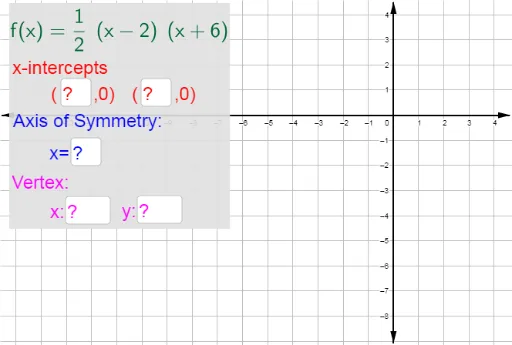
This example demonstrates how to graph a quadratic function given in intercept form, asking students to input the y-intercept, axis of symmetry, and vertex. Key math concepts include quadratic functions, intercept form, axis of symmetry, and vertex coordinates. GeoGebra commands and objects used in the construction summary are Textfield, Polygon, etc. Suitable for high school mathematics teaching, focusing on graphing quadratic functions and analyzing their properties.
GeoGebra Commands & Parameters
Textfield(a) → inputBox1_1Textfield(b) → inputBox2Textfield(c) → inputBox3Textfield(d) → inputBox4Polygon(G, H, I, J) → poly1, g_1, h, i, jTextfield(k) → inputBox1
AI Drawing Prompt Reference
Graph a quadratic function that opens upwards in intercept form y = a(x - p)(x - q), where p and q are the x-intercepts. Input the y-intercept a, and the x-intercepts p and q. Draw the parabola based on the inputs, and mark the vertex and axis of symmetry. Note that the vertex lies on the axis of symmetry.
The prompt above was compiled from the original drawing commands and is for reference only.