
Graphing Quadratic Functions - Practice Exam
Loading the math board and drawing, please wait…
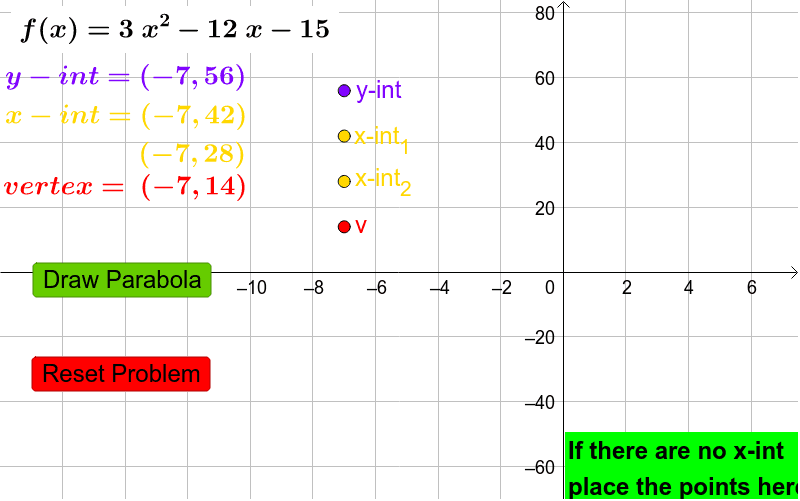
This example demonstrates how to graph quadratic functions and analyze their key features using GeoGebra. Core math concepts include standard form of quadratic functions, vertex, axis of symmetry, discriminant, and x/y-intercepts. Construction highlights: utilizes commands like Coefficients, Textfield, If, and involves objects such as f, Coeff, h, k, disc, InputBox1, A, B, C, D, text elements, and buttons for interactive analysis. Suitable for high school students and educators for practice and teaching purposes.
GeoGebra Commands & Parameters
Coefficients(f) → CoeffTextfield(f) → InputBox1If(disc ≥ 0, h + sqrt(disc) / ((2 * Coeff(1))), 1) → x1If(disc ≥ 0, h - sqrt(disc) / ((2 * Coeff(1))), 1) → x2
AI Drawing Prompt Reference
Create a graph of a quadratic function, highlighting its vertex, axis of symmetry, discriminant, and x/y-intercepts. Begin by calculating the discriminant from the input coefficients, then find the x-intercepts depending on whether the discriminant is non-negative. Clearly label and differentiate the vertex, axis of symmetry, and intercepts on the graph with text annotations.
The prompt above was compiled from the original drawing commands and is for reference only.