
Graphing Quadratic Equations: Observing a
Loading the math board and drawing, please wait…
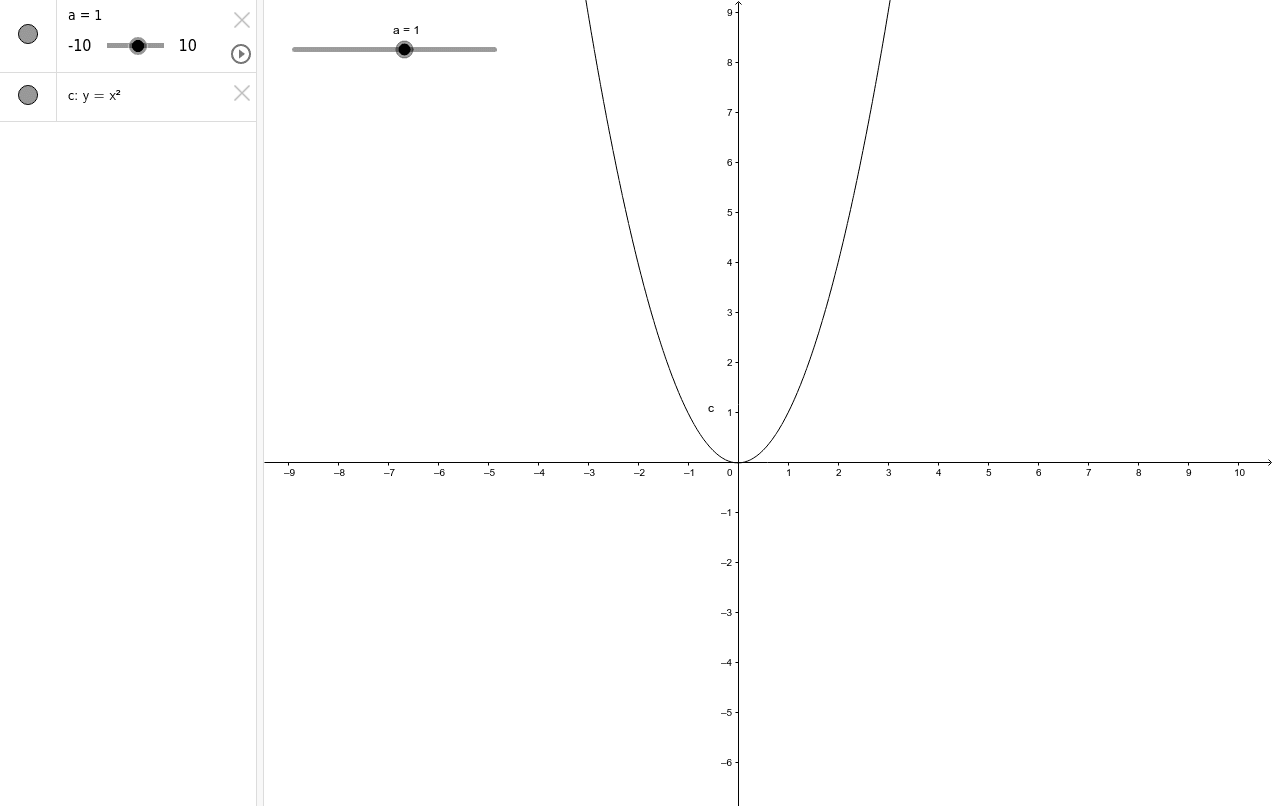
This example demonstrates the process of graphing quadratic equations, with a focus on observing the effect of coefficient a. Key mathematical concepts include quadratic functions, coordinate geometry, and function graphs. By adjusting the value of object a, changes in the direction of the parabola and the position of the vertex can be observed. Suitable for students at the junior high school level and above to learn about quadratic functions.
GeoGebra Commands & Parameters
Numeric a(1)y = (a * x^(2))
AI Drawing Prompt Reference
Draw a quadratic function graph in a Cartesian coordinate system. Create an adjustable coefficient for the quadratic term, initially set to 1, and plot the parabola y = coefficient × x², with its vertex at the origin. Show how changing the coefficient affects the direction and width of the parabola’s opening and the position of its vertex, so the viewer can observe the behavior of a quadratic function as its leading coefficient varies.
The prompt above was compiled from the original drawing commands and is for reference only.