
Graphing Quadratic Equations: Observing c
Loading the math board and drawing, please wait…
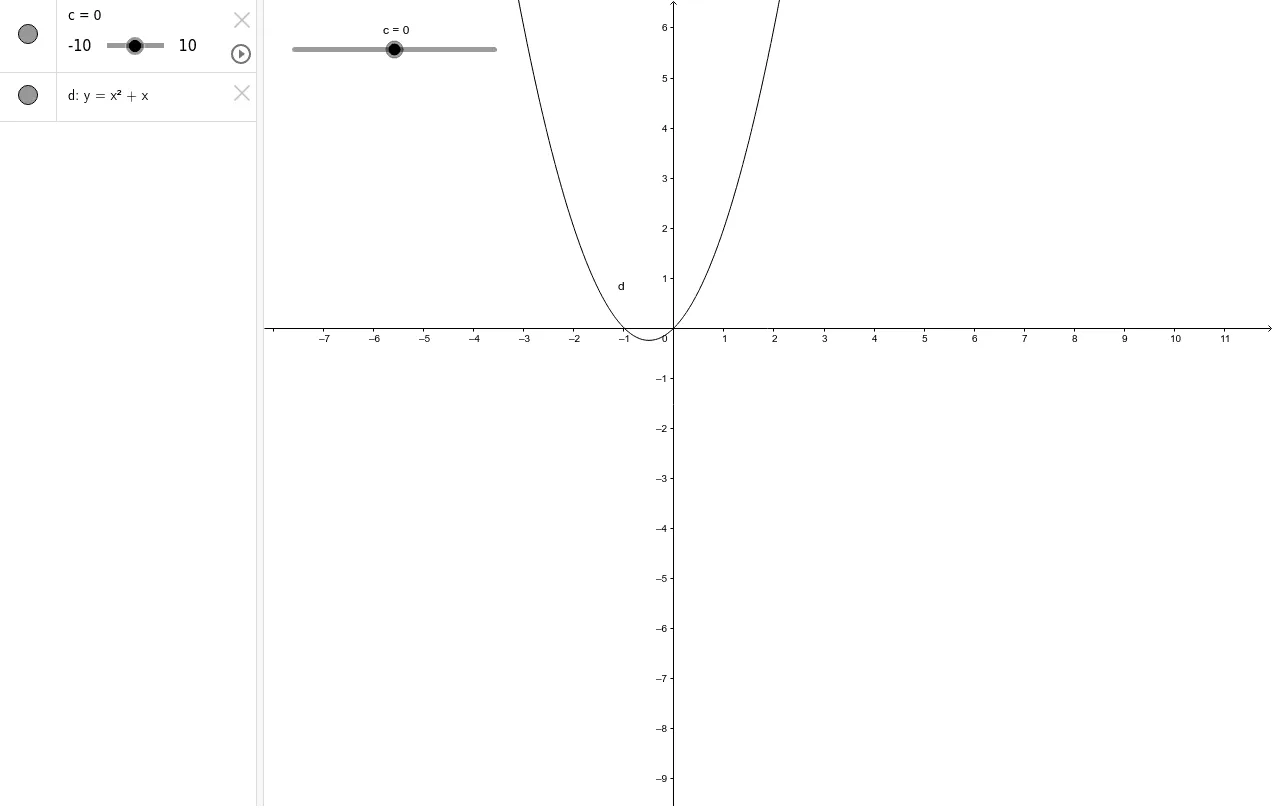
This example demonstrates the pattern of quadratic equation graphs, focusing on how parameter c affects the graph. By adjusting parameter c, one can intuitively understand the characteristics of quadratic function graphs. The objects c and d mentioned in the construction summary are achieved using the graphing commands in GeoGebra. Suitable for students at the junior high school level and above to learn about the properties and transformations of quadratic functions.
GeoGebra Commands & Parameters
Numeric c(0)y = x^(2) + x + c
AI Drawing Prompt Reference
Create a dynamic graph of a quadratic function, focusing on how the constant term affects the curve. Draw a parabola with equation x squared plus x plus a variable constant. Include coordinate axes and grid lines. The parabola opens upward, and its vertex moves vertically as the constant changes. Add a slider or adjustable parameter to modify the constant in real time, causing the parabola to shift up or down accordingly. This visual should clearly demonstrate the vertical translation effect of the constant term, with a clean and simple style suitable for middle school students.
The prompt above was compiled from the original drawing commands and is for reference only.