
Graphing Quadratic Equations - Homework 1
Loading the math board and drawing, please wait…
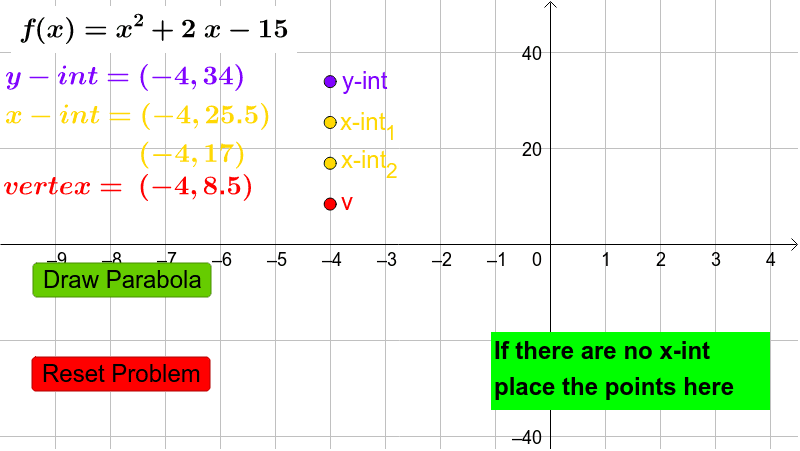
This example demonstrates how to graph quadratic functions by inputting coefficients and analyzing their properties. It involves core math concepts like quadratic functions, coefficients, vertex, discriminant, and intersection points. GeoGebra commands/objects used include Coefficients, If, Textfield, objects f, Coeff, h, k, disc, x1, x2, InputBox1, A, B, C, D, text1, text2, text3, xintcorrect, error, vertexcorrect, yintcorrect, button1, push, sp, allcorrect, text4, button2, text5, text6, button3, rr1, rr2, ra, rb, rc, text7. Suitable for high school mathematics teaching and student practice.
GeoGebra Commands & Parameters
Coefficients(f) → CoeffIf(disc ≥ 0, h + sqrt(disc) / 2, 1) → x1If(disc ≥ 0, h - sqrt(disc) / 2, 1) → x2Textfield(f) → InputBox1