
Graphing Parabolas in Vertex Form with Interactive Parameters
Loading the math board and drawing, please wait…
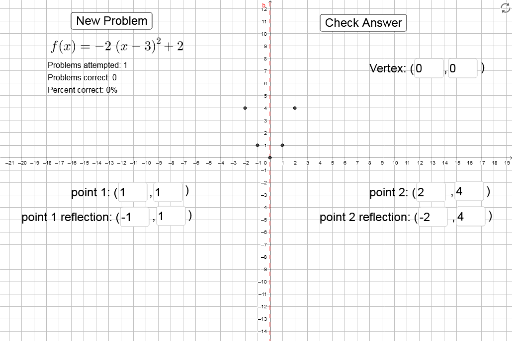
This GeoGebra example demonstrates how to graph a parabola in vertex form by entering the vertex coordinates and four additional points to construct the quadratic function graph interactively. Core mathematical concepts include the vertex form of a quadratic function y = a(x − h)² + k, the vertex (h, k), axis of symmetry, opening direction, vertical stretch/compression governed by parameter a, and the algebraic-geometric correspondence between points and the function graph. The construction uses GeoGebra commands such as Textfield, If, and Sum, together with objects including a, h, k, f, a₁, h₁, k₁, InputBox1 through InputBox10, points A, B, C, D, E, lists list1 and list2, and button1. Text fields and input boxes enable real-time parameter adjustment, while conditional logic and summation control point generation and graph display. Suitable for middle and high school mathematics instruction, classroom demonstrations, student-centered exploration, and visualization practice of parabola translation and scaling.
GeoGebra Commands & Parameters
Textfield(h_1) → InputBox1Textfield(k_1) → InputBox2Textfield(m) → InputBox3Textfield(c) → InputBox4Textfield(d) → InputBox5Textfield(e) → InputBox6Textfield(g) → InputBox7Textfield(i) → InputBox8Textfield(j) → InputBox9Textfield(l) → InputBox10If(h_1 ≟ h, A4 + 1, A4) → oSum(A4:A8) → A9
AI Drawing Prompt Reference
Graph a parabola by interactively constructing a quadratic function using vertex coordinates and four additional points. The vertex form is y = a(x - h)² + k, where a controls the direction and stretch of the parabola, and the vertex is at (h, k). Use text fields and input boxes to adjust parameters a, h, k in real time, generate points with conditional logic and summation, and display the function graph.
The prompt above was compiled from the original drawing commands and is for reference only.