
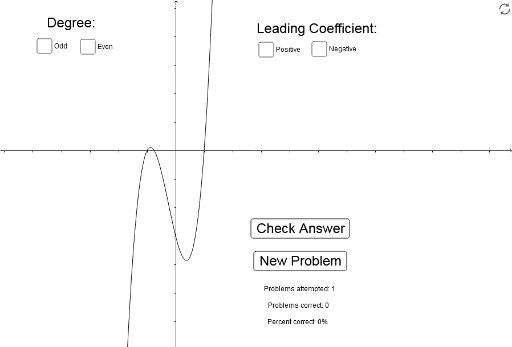
Degree and Leading Coefficient of Polynomial from Graph
Loading the math board and drawing, please wait…
In collections
Thomas S - Working with Polynomial Functions in IM3
This example demonstrates how to analyze polynomial functions from their graphs. Key concepts include polynomial functions, degree, and leading coefficient. Construction involves using GeoGebra commands like Sum, text, and list to create polynomial graphs. Suitable for middle or high school mathematics teaching, focusing on function graph analysis and polynomial properties.
GeoGebra Commands & Parameters
Sum(A4:A6) → A7
AI Drawing Prompt Reference
Draw graphs of several polynomial functions to demonstrate how to analyze their degree and leading coefficient from graphs. Include curves with different degrees, and label each polynomial's degree and leading coefficient, visually showing how changes in the graph reflect these concepts.
The prompt above was compiled from the original drawing commands and is for reference only.