
Graphing Parabola using Vertex and Axis of Symmetry
Loading the math board and drawing, please wait…
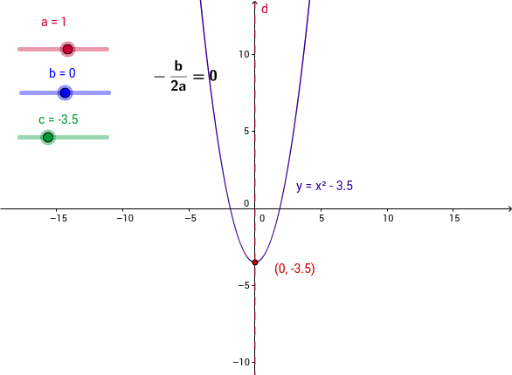
This example demonstrates plotting a parabola using its vertex and axis of symmetry. It covers core concepts like quadratic functions, vertex form, and symmetry in coordinate geometry. Construction utilizes the GeoGebra Vertex command with parameters a, b, c to define the parabola, alongside text labels and auxiliary lines for visualization. Ideal for high school students learning function graphs and algebraic properties.
GeoGebra Commands & Parameters
Vertex(parabola) → A, , ,
AI Drawing Prompt Reference
Draw an upward-opening parabola with its vertex clearly marked. First, sketch the vertical axis of symmetry as a dashed line passing through the vertex. Label the vertex point on the parabola. Then, plot a few symmetric points on both sides of the parabola to illustrate its symmetry. Include coordinate axes to show the parabola's shape, vertex location, and the relationship with the axis of symmetry.
The prompt above was compiled from the original drawing commands and is for reference only.