
Demonstration of Sine and Cosine Functions by NROC Project
Loading the math board and drawing, please wait…
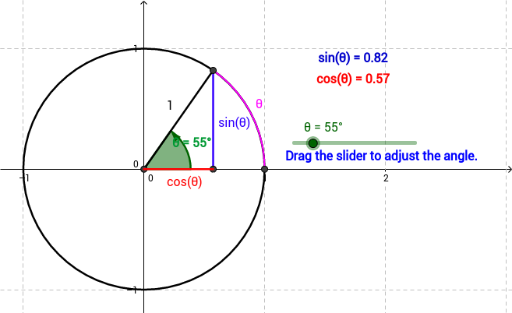
This example dynamically demonstrates the graphs of sine and cosine functions and their relationship with the unit circle. It involves core mathematical concepts such as trigonometric definitions, unit circle, angles, slopes, and curve sketching. GeoGebra commands like Intersect, Circle, Rotate, Angle, Segment, OrthogonalLine, and CircleArc are used in the construction. Suitable for high school mathematics education to understand the generation and properties of trigonometric function graphs.
GeoGebra Commands & Parameters
Intersect(xAxis, yAxis) → ACircle(A, 1) → cIntersect(c, xAxis, 2) → BRotate(B, θ, A) → B'Angle(B, A, B') → αSegment(A, B') → bOrthogonalLine(B', xAxis) → dOrthogonalLine(B', xAxis) → aIntersect(a, xAxis) → CSegment(A, C) → eSegment(B', C) → gCircleArc(A, B, B') → k
AI Drawing Prompt Reference
Draw the graphs of sine and cosine functions and show their relationship with the unit circle. Start by drawing the unit circle, then use rotation and angle measurement to construct the sine and cosine lines, and finally use an arc to represent the graphs of the sine and cosine functions.
The prompt above was compiled from the original drawing commands and is for reference only.