
Graphing Logarithmic Functions by Nick
Loading the math board and drawing, please wait…
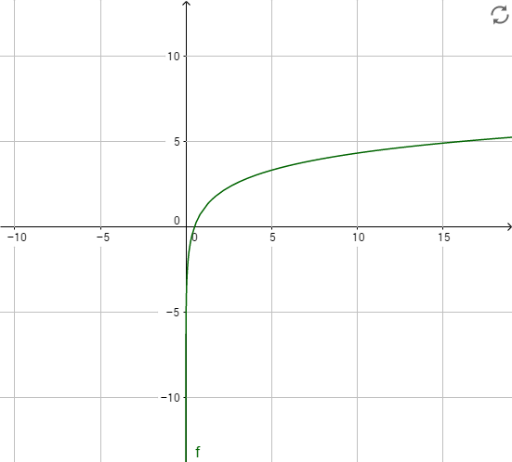
This example demonstrates the graph of logarithmic functions. It involves key concepts of logarithmic functions and uses GeoGebra objects b, c, d, m, n, f to illustrate the characteristics of different logarithmic functions. Suitable for high school math education to help understand the properties and graph transformations of logarithmic functions.
GeoGebra Commands & Parameters
Numeric b(2)Numeric c(1)Numeric d(1)Numeric m(1)Numeric n(0)f(x) = (d * log(b, (m * x) + n)) + c
AI Drawing Prompt Reference
Draw the graph of logarithmic functions to show how different parameters affect the function's shape. First, set several key numerical parameters, then construct the logarithmic function based on these parameters to observe how the function graph transforms with changes in parameters, reflecting the basic properties and transformation rules of logarithmic functions.
The prompt above was compiled from the original drawing commands and is for reference only.