
Graphing Logarithmic Functions by GülseminTuran
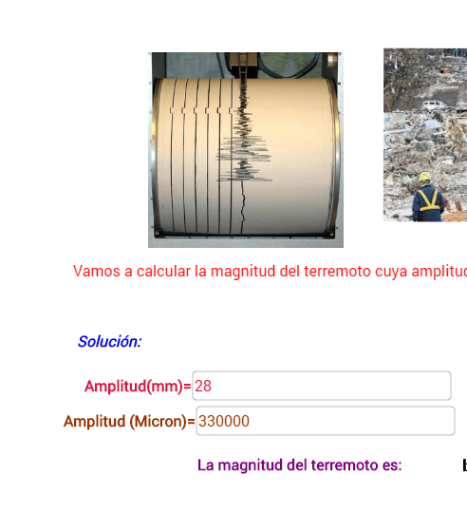
Loading the math board and drawing, please wait…
This example demonstrates the geometric construction of logarithmic functions. Key mathematical concepts include logarithmic functions, exponents, and rotation. Using GeoGebra commands such as Textfield and LaTeX, the graph of a logarithmic function is constructed. Suitable for high school mathematics education and learning.
GeoGebra Commands & Parameters
Textfield(a) → MetinAlanı1Textfield(c) → amplitudeLaTeX(b, true, true) → text4
AI Drawing Prompt Reference
Create a geometric construction diagram of a logarithmic function graph. Include two adjustable input fields for the base parameter and the amplitude parameter, along with a displayed mathematical formula in LaTeX style. The logarithmic curve should show typical growth or decay shape, varying with the base parameter, while the amplitude parameter controls vertical stretching. Coordinate axes are clearly labeled, and the curve passes smoothly through key points. The overall layout suits high school math education, emphasizing function transformation and geometric intuition.
The prompt above was compiled from the original drawing commands and is for reference only.