
Graphing Logarithmic Functions by blairfreetide
Loading the math board and drawing, please wait…
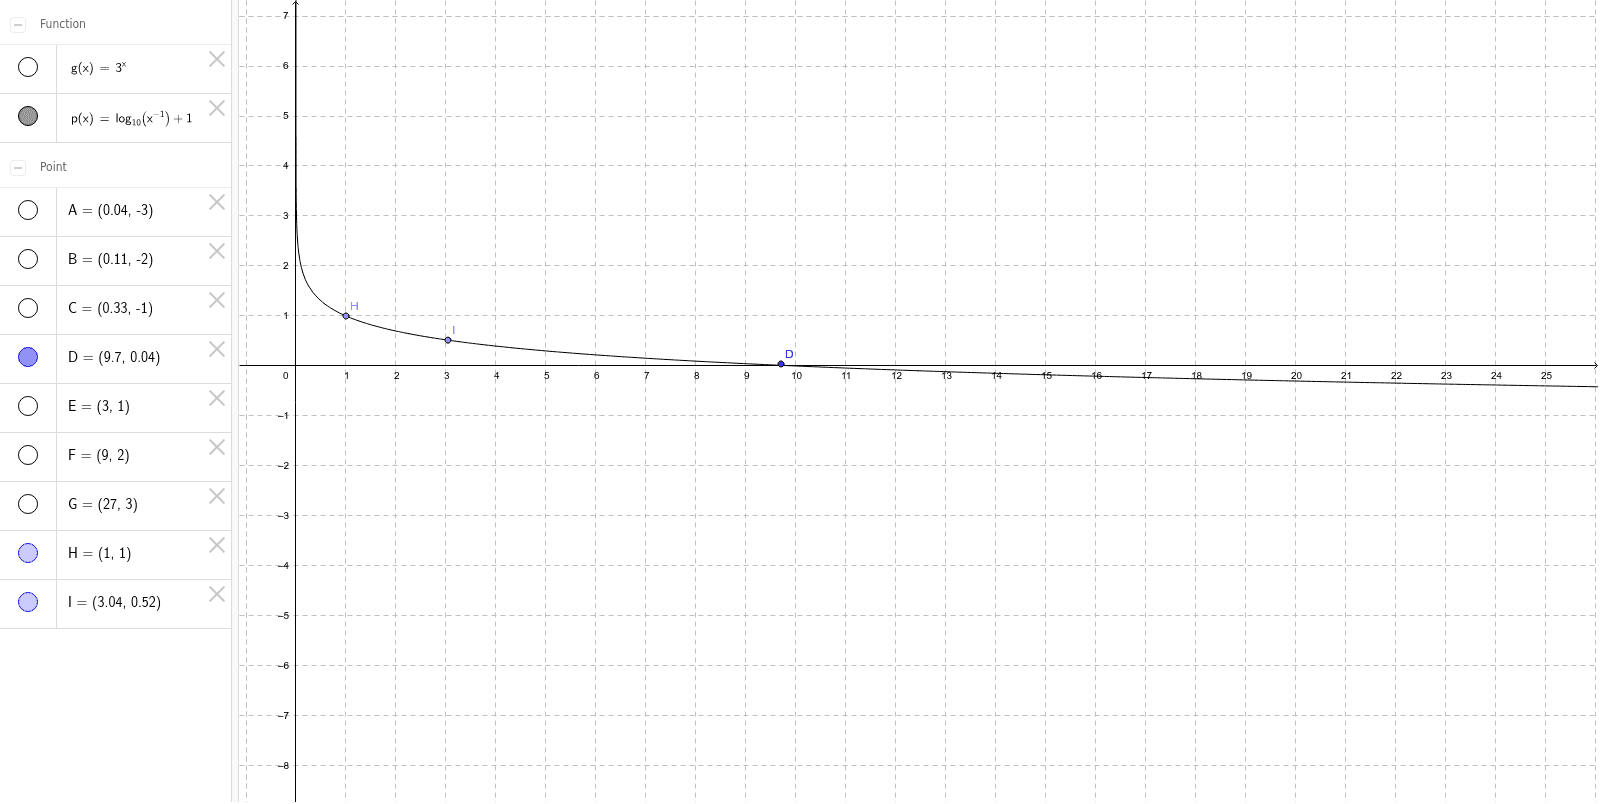
This example demonstrates the graphing of logarithmic functions and their geometric significance. The core mathematical concepts involve logarithmic definitions, function properties, and image transformations. Construction points include using GeoGebra commands such as Point, A, B, C, D, E, F, G, p, g, H, I. Suitable for high school mathematics learning or teaching.
GeoGebra Commands & Parameters
Point(p) → HPoint(p) → I
AI Drawing Prompt Reference
Draw a logarithmic function curve on a coordinate plane. Mark two distinct points on the curve, positioned at different locations along the graph. The curve should show the typical shape of a logarithmic function, passing through (1,0) and increasing gradually. The two points should be clearly visible on the curve, illustrating that any two points can be chosen on the graph. This visual is suitable for high school math learning about function properties.
The prompt above was compiled from the original drawing commands and is for reference only.