
Graphing Lines
Loading the math board and drawing, please wait…
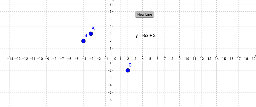
This example demonstrates how to graph lines in GeoGebra, focusing on coordinate geometry concepts like line equations and points. It uses commands such as Line and interactive objects like sliders (a), buttons (button1), and text elements (text1, text2) to illustrate the process. Suitable for middle/high school mathematics education, helping students understand line equations and their graphical representations.
GeoGebra Commands & Parameters
Line(A, B) → b
AI Drawing Prompt Reference
Draw two intersecting lines in a coordinate system, showing their equations and intersection point, with sliders to adjust the lines' positions, a button to toggle auxiliary information, and labels for key points and line equations, suitable for educational purposes to demonstrate the graphical representation of line equations.
The prompt above was compiled from the original drawing commands and is for reference only.