
Graphing Linear Inequalities by Rachel DellOrto
Loading the math board and drawing, please wait…
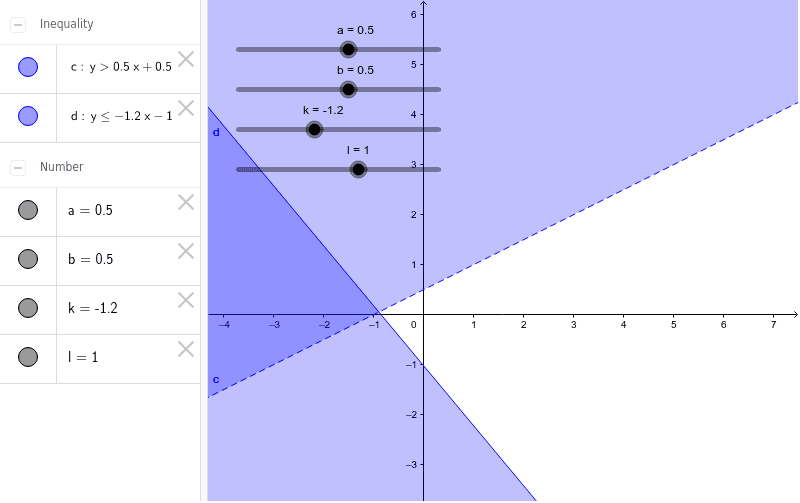
This example demonstrates how to graph the solution set of linear inequalities in a coordinate plane. Key math concepts include linear equations, inequalities, region representation, and coordinate geometry. It uses GeoGebra commands/objects a, b, c, k, l, d to define line equations and inequality boundaries, with shaded regions indicating solutions. Suitable for high school students learning the geometric meaning and practical applications of linear inequalities.
GeoGebra Commands & Parameters
Numeric a(0.5)Numeric b(0.5)c(x, y) = y > (a * x) + bNumeric k(-1.2)Numeric l(1.0)d(x, y) = y ≤ (k * x) - l