
Graphing Linear Inequalities by GeoGebra Team
Loading the math board and drawing, please wait…
In collections
Learn GeoGebra Classic
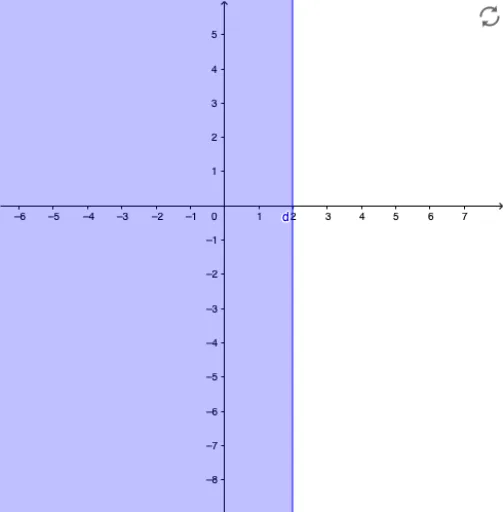
This example demonstrates how to graph and explore linear inequalities. Key mathematical concepts include the properties and graphical representation of linear inequalities. By adjusting objects a, b, c, and d, you can observe the boundary line and solution region of the inequality. Suitable for students in middle school and above.
GeoGebra Commands & Parameters
Numeric a(1)Numeric b(1)Numeric c(3)d(x) = (a * x) + b ≤ c
AI Drawing Prompt Reference
Graph the linear inequality ax + b ≤ c, where a, b, and c are 1, 1, and 3 respectively. First, draw the line ax + b, then indicate the solution region of the inequality.
The prompt above was compiled from the original drawing commands and is for reference only.