
Graphing Linear Equations with Slope & Y-Intercept
Loading the math board and drawing, please wait…
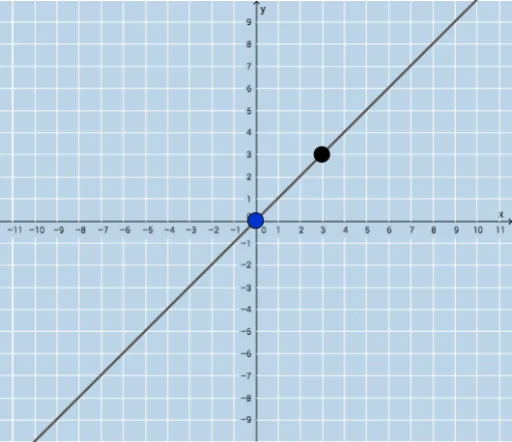
Interactive applet demonstrating how to graph linear equations using slope and y-intercept. Covers core math concepts: linear equations, slope, y-intercept. Constructed with GeoGebra commands like Sequence, Union, Random, Point, Line, FractionText. Ideal for middle school and above students to explore linear function graphs.
GeoGebra Commands & Parameters
Sequence(i, i, -10, -1) → aSequence(i, i, -10, -1) → bSequence(i, i, 1, 10) → cUnion(b, c) → dRandom(-12, 12) → ePoint(x = 0) → ALine(A, B) → gFractionText(Slope[f]) → text1FractionText(f(0)) → text2
AI Drawing Prompt Reference
Draw a coordinate plane with a straight line representing a linear function. Mark integer points along the x-axis from -10 to 10, excluding zero, in both negative and positive directions. Place a random point on the y-axis as the line's y-intercept, and use another point to define the line. Display the slope of the line as a fraction and the y-intercept value as a fraction near the graph. The scene should illustrate how slope and intercept determine the line's position.
The prompt above was compiled from the original drawing commands and is for reference only.