
Graphical Solution of Linear Systems Quiz
Loading the math board and drawing, please wait…
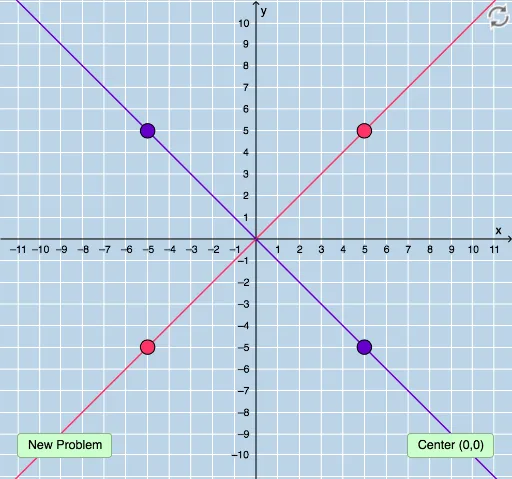
This example demonstrates solving systems of linear equations graphically with immediate feedback. It involves core concepts like linear equations and functions, and is constructed using GeoGebra commands such as Random, Line, Sequence, Union, RandomElement, Slope, FractionText, and Textfield. Ideal for middle school and high school students to visualize and understand the graphical method for solving linear systems.
GeoGebra Commands & Parameters
Random(-10, 10) → aRandom(-10, 10) → bRandom(-10, 10) → cLine(A, B) → fSequence(i, i, -10, y(B) - 1, 1) → dlowerSequence(i, i, y(B) + 1, 10, 1) → dupperUnion(dlower, dupper) → dlistRandomElement(dlist) → dLine(A, C) → gSlope(f) → eSlope(g) → hFractionText(e) → text1FractionText(h) → text2Line(D, E) → iLine(G, F) → jTextfield(k) → InputBox1Textfield(l) → InputBox2
AI Drawing Prompt Reference
Draw two random lines and generate parallel lines above and below each of them to form a shaded area. Label the slopes of the two original lines and randomly select one segment between the parallel lines, labeling its slope. Add two input boxes below the graph for entering answers.
The prompt above was compiled from the original drawing commands and is for reference only.