
Graphing Linear Equations with Slope & Y-Intercept by Sangeeta Gulati
Loading the math board and drawing, please wait…
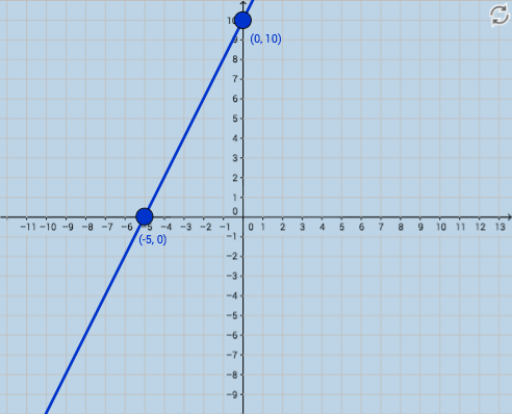
This example uses an interactive applet to help students graph linear equations using slope and y-intercept, providing instant feedback. It demonstrates the graph of linear equations, involving key math concepts such as slope, y-intercept, and linear equations. GeoGebra commands used include Sequence, Union, Random, Line, and FractionText. Suitable for students in middle school and above learning to graph linear equations.
GeoGebra Commands & Parameters
Sequence(i, i, -10, -1) → aSequence(i, i, -10, -1) → bSequence(i, i, 1, 10) → cUnion(b, c) → dRandom(-12, 12) → eLine(A, B) → gFractionText(Slope[f]) → text1FractionText(f(0)) → text2
AI Drawing Prompt Reference
Create an interactive graph showing how to plot linear equations using slope and y-intercept. Include horizontal and vertical sequences of points from -10 to -1 and 1 to 10 respectively, merge them, pick a random point as the y-intercept, and draw a line connecting it to any point in the sequences. Label the slope and y-intercept values for educational purposes.
The prompt above was compiled from the original drawing commands and is for reference only.